Key takeaways
- You need to get your hands dirty: Getting great at BI tools takes practice, and practice requires a lot of sample data.
- SpaceParts is a free dataset for learning: We created it and released it via our learning platform, Tabular Editor Learn, in 2023.
- It suits beginners through experts: This article covers different scenarios you can practice depending on your current skill level.
This summary is produced by the author, and not by AI.
If you want to learn new tools and techniques to work with data, then theory isn't enough; asking LLMs, studying documentation and blogs, or watching videos can only get you so far. For the best results, you should also get your hands dirty. That means practicing with different data, tools, and technology.
Unfortunately, getting good sample data for practice isn’t very easy. You can’t easily use data from your organization for learning purposes, and many common sample datasets like Adventure Works or Hawaii Tourism are too simple to meaningfully represent the complexity of data you’ll see “in the real world”. Thankfully, there are other options, including the SpaceParts dataset, which we released via Tabular Editor Learn in 2023.
To lead with the most important information, you can connect to the public SpaceParts SQL database with the following credentials for noncommercial, personal use:
- Server:
te3-training-eu.database.windows.net - Username:
dwreader - Password:
TE3#reader!
It is against the license terms to use this dataset for commercial use. This includes giving trainings, creating advertising or demos for commercial products or services, and testing or development of these commercial products and services. For more information about these license terms and how we enforce them, see this document.
In this article, we will give a brief introduction to the SpaceParts dataset, explaining how you can get started using it in Power BI, Microsoft Fabric, and other tools. We’ll also explain the business process logic and personas the data represents and provide some suggested scenarios (but not solutions – at least not yet) for you to practice.
Where can you find sample data?
Aside from the SpaceParts dataset, there are various options where you can find and use sample data. Here are some different options that you might choose from:
- Common sample datasets like Adventure Works, Hawaii Tourism, Taxi, Superstore, etc**.** These datasets are well-known and easy to use, and a lot tutorials and trainings use them. So they can be a good option for complete beginners. However, they are also overly simple and don’t represent real-world scenarios very well. Of all of these datasets, the Superstore dataset from Tableau is probably best for working with Power BI, since it balances simplicity and depth. \
- Sample data that you generate by using generative AI. This is relatively easy to do, and you can create quite creative and interesting sample data tailored to specific scenarios or segments you have in mind. However, the data volume is often too small, and the structure won’t typically represent real data sources very well unless you specify explicitly the structure that you want the data to take. This is generally only a good option when you need something specific.\
- Sample data that you generate with generators like the Contoso generator from SQLBI. The Contoso generator is likely one of the quickest and easiest ways to get sample data for Power BI. There are even several out-of-the-box Power BI Desktop files that you can download – from 10k to 100M rows. This is another great option for beginners. Experts can also customize the generator, but this takes time and can be complex to set up and do.\
- Personal data from services or devices that you use. You can (especially if you live in Europe) extract or request data from most services that you use, including streaming services (Netflix, Spotify), wearables (Fitbit, Oura), and large platforms (Google Takeout, Meta). This data requires effort to extract, transform, and prepare for use, and you need to put in a good effort to make it usable. Unfortunately, this can sometimes require too much effort. You can get quickly overwhelmed, so this option is typically best for intermediates or experts who have a clear idea in mind of what they want to do and why.\
- Datasets listed on Kaggle, or included as part of tools, packages, and libraries. These sample data vary depending on what you are looking for and which tools you are using. Power BI has a sample dataset that you can use with the Web connector. You can retrieve the data from an empty Power BI file by selecting the “sample data” button.
This isn’t a complete list; there are other examples elsewhere. As always, though, you should understand there is no single best option; what is most important is that you use data to learn by practicing, and practice effectively and intentionally. To get the most from a practice or portfolio exercise in Power BI, consider the following tips:
- Find data that is appropriate for the tool and technique you want to practice.
- Consider ways to inflate the row count or complexity if the data is small and you want performance and optimization to be a factor to consider in your practice exercise.
- Consider ways to randomly add a small amount of data quality issues if you want this to be a factor to consider. A good way to do this is to provide the sample data to an LLM and ask it to return a modified set of tables with typical data quality issues, but not tell you what they are. It’s like playing hide and seek with data.
- Set a specific objective for your practice. Be as specific and narrow in your scope as possible. When practice and portfolio projects are too vague or large, it reduces the chance you finish and the possible value for yourself.
- Try to create things that you will use, yourself. For instance, a dashboard to track your own data, or data you’re interested in. Otherwise, you can create templates and objects that you can easily re-use in work projects, saving you future time by stockpiling a library.
- If you won’t use the result of the practice or project, then before you start, answer the question: “Why should someone care about this?” How would you explain it to a recruiter, a potential client, or a peer? You don’t need to do this if you are just doing a light exploratory exercise, like trying out a new tool or feature for the first time.
Getting hands-on experience with tools and data is critical to learning and growth. However, you have to do this effectively; don’t just expect to learn by osmosis!
Introducing SpaceParts
The SpaceParts dataset is a free dataset provided by Tabular Editor from a public SQL database that you can use to learn or practice any tools. It was built from the ground up by defining the business rules and process for a fictional company that sells spaceship parts (gotta make it fun, right?). The dataset resembles a result that you might see from an order-to-cash SAP module.
Download the SpaceParts ZIP-file
You can download the dataset below. First, here is how we built it and how it works.
How did we make the SpaceParts dataset?
In short, the dataset was made from a generator in Python built from scratch and based on predefined business rules, master data, and personas. We first defined SpaceParts as a fictional company and then its business logic, including exceptions, roles, and process flaws. The dataset isn't just random numbers and rows; there is intentional and explicit logic that represents something happening in a process.
The SpaceParts organization has a lot of challenges with their data, and how they can use it effectively. The world and market seem to be moving fast with all the hype around AI, predictive analytics, and actionable or automated insights. For SpaceParts, it’d just be great if they could report out a consolidated view of their orders, sales, and shipments… without everyone bringing their own exports and Excel files to the table!

Here’s several examples of how the SpaceParts dataset reflects their organization:
- Seasonality and patterns: As the month progresses, sales increase. SpaceParts typically invoices more at the end of a month than at the start. This is because they measure sales performance monthly, so sales teams push for customer shipments and billing as the month nears its end, so they can meet their targets. To a lesser extent, this is also reflected in weeks of a quarter, but not in months or weeks of a year.
- Exceptions: On weekends or holidays, sales are very small. SpaceParts has limited weekend shipping, and its typically due to processes in systems, and not representative of real shipments leaving warehouses or arriving at customers.
- Logic: SpaceParts reports both invoice and delivery revenue, minus adjustments like warranties, returns, and cancellations. Depending on the report, these calculations might differ.
- Flaws: These adjustments also include penalties, including a discount to customers if shipments are too late, and interest on customer invoices that are paid too late. However, there are some data quality issues with the dates used to determine what is on-time and late, and the definition of what is “on-time” in SpaceParts varies depending on the team.
This information is relevant when reporting sales, with design decisions like the following:
- Measures for month-to-date and quarter-to-date sales.
- Sales measures that add revenue and consider adjustments, accordingly.
- Sales reports for month-to-date figures should report trends by workdays MTD and not by calendar date.
- Figures on weekends or holidays should be binned with the previous workday in the same month, or the next workday if the month begins on a weekend or holiday.
This is just one example, but you can see how the process leads to specific model and reporting requirements, and considerations for the model design; you cannot just take the SUM of sales and make your report, and that’s also not how it works in Power BI projects in the “real world”.
What are some features of the dataset?
Here’s a quick overview of some features or properties of the dataset:
- A high degree of complexity and variability that’s intended to represent a real-world business.
- The dataset is designed to be usable but at the same time also overwhelming in its complexity and scope.
- The dataset is designed to force you to think about the business processes to use it; making assumptions and designing models, reports, and other data products without thinking from the perspective of the business will lead to suboptimal results or a frustrating experience as you force the data to work in ways that doesn’t work.
- It’s also designed to force you to think about and deal with the data quality flaws before you can use it.
- It has intentional patterns, like seasonality and customer, region, and product-specific trends or growth.
- 10M+ rows in the main fact tables.
- Multiple dimensions that support both snowflake and traditional star schema design.
- Data that covers the following business processes:
- Sales and orders in quantity and volume.
- Sales performance (against an annual budget and monthly forecasts).
- Shipping and on-time delivery (OTD) by quantity, volume, and order lines.
- Open orders and fulfilment.
- Profitability (of both products and shipment services).
- Customer and product segmentation.
- Common data modeling challenges, including:
- Missing or improper keys (for certain date fields).
- Multiple fact tables.
- Fact tables with different detail level (levels of granularity).
- Data quality issues due to both flaws in upstream transformations and flaws in the underlying business processes.
- Multiple date fields to phase data differently, depending on user needs.
- Inclusion of personally identifiable information and organizationally identifiable information.
- Suboptimal data structures and schema design, particularly for necessary patterns like RLS or currency conversion.
- Multiple exchange rate types (monthly, average, and annual/budget rates).
- Handling document types including cancellations, warranties/returns, and premium shipping (express).
- Custom regions, including taxation/tariffs and penalties for late shipments or invoice payments.
- …and more.
- Sample files and models that are littered with suboptimal patterns, DAX, and design. This is to help you learn to audit and optimize models. These issues lead to the following challenges that you can practice solving yourself:
- Slow reports.
- Inaccurate or flawed calculations.
- Complex models and DAX that are difficult to manage or maintain.
- Fun Easter eggs, inside jokes, and references that pertain to both the Microsoft data community, science fiction, and popular culture.
Of course, to benefit from these features, you need to understand how the dataset works.
How does the SpaceParts dataset work?
An example model diagram from one of the SpaceParts sample models is below:
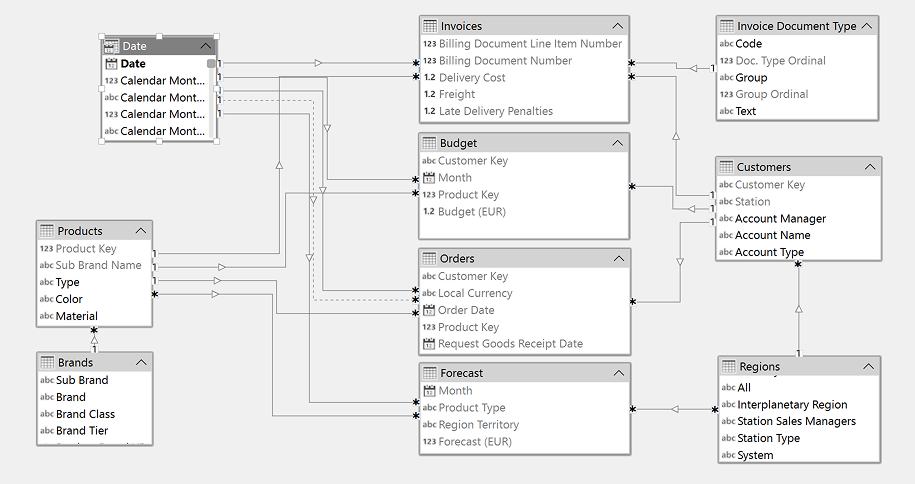
In short, there are various tables:
- Fact tables
- Invoices: Contains billing document (invoice) line items for product sales to customers, as well as aggregate cost information for those products. There’s also shipment information, like freight surcharge (revenue from delivery) and cost. Each line item has a billing date (when the invoice was created) and a ship date (when the product was shipped). A billing document can be of different types, like warranty or returns. Invoices include both quantity and volume, where invoice values are in a local currency, and require conversion to a common currency before reporting.
- This table can therefore be used to aggregate simple information pertaining to sales, shipments, and profitability.
- Orders: Contains sales order document line items for product orders placed by customers. The orders table contains important dates that are used to determine whether a product is delivered on time or not. Orders include both quantity and volume, where invoice values are in a local currency, and require conversion to a common currency before reporting.
- This table can therefore be used to determine order volume, open orders, and on-time delivery.
- Budget: Contains annual sales targets for products and customers by month. The budget is a key target for sales performance.
- Forecast: Contains a revision of the budget and is updated every month. The Forecast derives from manual inputs in an Excel file and is at a different level of detail (more aggregated) than the other fact tables. This is a very common scenario and challenge for data modeling in Power BI.
- Dimension tables
- Customers: Contains information about customer accounts, including customer hierarchies and account manager names (PII). Customers map via a customer key, which is a sold-to number.
- Regions: Regions are based on the physical address of customers. Regions are not geographical and rather fictional interplanetary regions, given that the dataset is science-fiction themed for fun. Thus, one caveat of the dataset is that you cannot use it to practice working with geospatial information. Regions include the names of regional sales representatives (PII). Regions map via customers (system).
- Products: Contains information about products, including product hierarchies and product sales representatives (PII). Products map via a product key.
- Brands: Contains information about product brands and brand managers (PII). Brands map via products (sub-brand).
- Date: Date tables can be made using the various date fields in the model (i.e. with Bravo).
- For sales, use Billing Date from Invoices.
- For shipments, use Ship Date from Invoices.
- For orders, use Order Date from Orders.
- For open orders and on-time delivery, use the various date fields from Orders to determine order point-in-time status. You can optionally use the OTD indicator in invoices for a simpler calculation.
- Invoice Document Type: States the type of invoice, such as whether it is a return, warranty, etc. “Goods lost in transit” is equivalent to a cancellation.
- Order Document Type: States the type of order.
- Employees: Contains relevant information about employees and their roles and emails. You can use this information to design row-level security (RLS). The data structures of the Employees table and the various dimension tables are intentionally not ideal for a good RLS design; you will need to do transformations of the data or write more complex table expressions to get a functional result.
- Other tables
- Exchange rate: Contains the monthly and budget rates for each day.
- Budget rate: Contains the current budget rates (determined annually) for each currency. Currencies are fictional and relate to a relevant region. The “standard” currency to benchmark all values is “EUR”.
To help you get started with the SpaceParts dataset, we recommend that you use one of the sample files below.
Sample files and starter kits
We have produced several sample files (download the ZIP-file here) for you to quickly and easily get started working with the SpaceParts dataset.
- Sample Power BI files: These are PBIT, PBIX, or PBIP files that you can use in Power BI Desktop. Recall that the samples and the underlying data both exhibit intentional flaws that you might have to deal with when implementing something.
- Model samples: These files contain the basic setup for the SpaceParts dataset with tables, columns organized in display folders, and relationships. Only basic DAX measures are included (for instance, the total sales or order quantities), and patterns like currency conversion aren’t implemented.
- Audit samples: These files are from the full Tabular Editor training on Tabular Editor Learn. They vary in complexity and size. They are also full of mistakes and issues for you to practice auditing models.
- Sample ETL files: These are notebook
.ipynbfiles or data pipeline definition files that you can upload into Fabric to copy the SpaceParts dataset into a Lakehouse (or data warehouse).
If you find the SpaceParts dataset useful and interesting, we can invest in creating more free templates, like analyses in notebooks, visualizations in reports, or examples in models or DAX. We’re always looking for helpful ideas for our community… so you just have to ask! Make some noise on our social media with a post or comment by tagging Tabular Editor, and we’ll see it.
Example scenarios for beginners, intermediates, and experts
Here are some scenarios that you can use to work with this dataset. The instructions for each scenario are minimal to be concise and offer you room for interpretation and extrapolation. You can always comment on this blog post if you need more specificity or explicit direction, but the point is just to narrow the scope and objective so you can start.
Beginners

These scenarios are simple and require minimal data modeling or effort.
- Exploration or freeform practice: If beginners want to use the SpaceParts dataset for exploring and practicing, then we recommend taking only the Invoices, Customers, and Products tables, and creating measures for the Total Invoice Quantity (the SUM of Net Invoice Quantity). This way, you don’t have to deal with multiple fact tables, currency conversion, or model designs.
- Data modeling challenge: You need to create a semantic model that uses the Customers, Regions, Orders*,* and Date tables.
- Combine the Customers and Regions tables together by joining the Regions table to the Customers table. Is it possible? Can you disable the loading of Regions?
- Link the new Customers table and the Date table to the Orders table. You want to be able to eventually report Order Quantity by the Order Creation Date, but there’s no Order Creation Date in the dataset. What date do you think this corresponds to? What relationships do you need to create here?
- Validate the new relationships between the Customers and Date tables and the Orders table. Do you see any problems? If so, try to diagnose them and pinpoint the exact issue. Do you think this issue is a data quality problem or a business process flaw? What would you do if you saw this in a real company?
- Hint: First, orders are created. A customer requests to receive the goods on a specific date. The goods are then shipped, and the customer confirms that they received these goods. Upon receipt, the customer should pay the invoice (billing) in accordance with their contract terms (typically 14 or 30 calendar days).
- Reporting challenge: Create a report that focuses on the number of orders by key account.
- Create a default filter that removes customers that aren’t key accounts, private buyers, or government contracts.
- The report should show the total orders, and then a breakdown by key account, private buyer, and government contract.
- Show both the trend of order quantity by month for the total, and each of the three categories mentioned above.
- Show the top product types both in total and by key account, government contract, or private buyer.
- Optionally, include a second report page that lets users drill through to see details by customer account.
Intermediates

These scenarios require more effort and thought to get a usable result.
- Exploration or freeform practice: If intermediates want to use the SpaceParts dataset for exploration or freeform practice, then we recommend taking all fact and dimension tables, and setting up basic currency conversion to convert Invoices and Orders from local currency to EUR by using the Budget Rate table. We also recommend experimenting with roleplaying dimensions with the different date fields, and handling the various data quality issues or flaws that you find as you work.
- Data modeling challenge: You need to create a model that reports Invoices versus Forecast by Customer and Date. The model must include dynamic currency conversion. Use the Exchange Rate and/or Budget Rate tables for this.
- Users only want to use the Monthly Rate for currency conversion. How should you implement this? Hint: consider the currency conversion DAX pattern from SQLBI.
- Forecasts are updated monthly and set at the customer key account, month, and product type level. How can you proceed to integrate the forecast in your model despite this detail restriction? Are there considerations for your model? For your DAX? Hint: consider the many-to-many relationship guidance.
- Some users want to see sales, but some want to see shipments. You learn that this involves the same measure phased by the Billing Date or the Ship Date of the Invoices table. How can you create separate Sales and Shipments measures? Hint: consider the active vs. inactive relationship guidance.
- Don’t forget to calculate Sales or Shipments as:
Total Net Invoice Value (including all adjustments and excluding calculations)
+ Total Freight
+ Total Late Delivery Penalties
+ Overdue Payment Penalties
- Taxes & Commercial Fees
- Reporting challenge: Create a sales performance report that focuses on monthly sales versus forecast by key account. It should be possible to identify the top- and bottom-performing key accounts. Since the forecast isn't available by product, users want to be able to explore YoY product sales for a single key account and its members.
- On page 1: Create an overview focused on sales vs forecast performance.
- On page 2: Focus on product sales details by key account.
Experts

These scenarios continue and extend the intermediate challenges.
- Exploration and freeform practice: For experts, we recommend setting up incremental refresh on the Invoices table (using Billing Date) and Orders table (using Order Date). We also recommend implementing the data security rules from the Employees table, which will require some restructuring of the data. Finally, we recommend setting up dynamic currency conversion with Monthly Rates from the Exchange Rate table, or both rate types.
- Data modeling challenge: Users want to add the Budget to the model, and they also need more flexibility to choose the target they want to compare to. Users can’t agree on which exchange rate they want to use, so they want the option to choose between all three. Finally, users want the reports to focus on only one month at a time, looking at month-to-date sales performance by workday.
- Users want to use the monthly rate, budget rate, and the average rate (which is the rolling 12-month average of the monthly rate). Do you see any obstacles to implementing this?
- How can you adjust the DAX so that users can flexibly choose both a rate and between different targets for comparison (like Budget, Forecast, and PY Sales)? Can you do this with field parameters? Why or why not?
- The Budget and Forecast are by month, but users want to see an MTD trend by workday. How can you implement this? Is there a better approach you can think of other than a straight linear breakdown of the budget by workday?
- Reporting challenge: Incorporate these new requirements in the reports. The reports should focus on the month-to-date sales and product sales details for a single month, and have slicers to select the various targets, currencies, and rate types. For better reports, try to design a report that follows the 3-30-300 rule.
For further reading
- Power BI for beginners: 7 mistakes you don't want to make (Tabular Editor). A guide to the most common early mistakes in Power BI that map directly to the beginner-level SpaceParts scenarios described in this article.
- The SpaceParts Co. Dataset (Tabular Editor). The original dataset announcement, with additional background on how SpaceParts was built and its earlier version.
- Currency conversion (DAX Patterns). The authoritative DAX pattern for implementing multicurrency conversion, which the intermediate SpaceParts challenge references explicitly.
- Introducing the 3-30-300 rule for better reports (SQLBI). The design principle referenced in the expert SpaceParts reporting challenge to guide how reports should structure information density.
In conclusion
Learning requires both passive (reading/watching) and active (thinking/doing) steps. As the BI market continues to evolve and accelerate, it’s becoming more important than ever for both advanced and novice practitioners to effectively learn new tools and methods to work with data. One way to do this is by using practice datasets, but you should strike a balance between datasets that are too unwieldy and those that are so simple that you’re not training the right muscles hard enough to grow.
The SpaceParts dataset by Tabular Editor is a free dataset that you can use to learn Power BI, Fabric, and anything else. It’s complex and overwhelming by design, and built with business processes in mind. We hope you find it useful!
Practice real semantic model patterns with SpaceParts in Tabular Editor 3.
Give Tabular Editor a spin