
Key takeaways
- PBIR opens the report layer to scripting: With the Power BI Enhanced Report format, you can use Tabular Editor C# scripts to manipulate reports and visuals.
- It's still an emerging area: SemPy Labs handles some operations on published reports, but it's limited, so scripting PBIR files is largely starting from scratch.
- Changes aren't live in Desktop yet: You have to close and reopen the report to see changes, which currently limits the appeal of these scripts.
This summary is produced by the author, and not by AI.
Introduction
Tabular Editor’s C# Script functionality has long been one of its key killer features. It allows you to manipulate a model programmatically, helping you streamline or automate many tasks for convenience. You can even use it to call APIs, like one to format Power Query or use LLMs. Even if you don’t know C#, you can use LLMs to help you write the scripts.
If you check online, you will find many scripts that will help you all the way from creating SUM measures for selected columns to more complex use cases such as creating measures to identify referential integrity violations in the model, or add calculation groups and model-dependent DAX UDFs. But did you know you can now script the report layer too? I have been experimenting with this and at Tabular Editor we believe that many more could benefit from this.
Here you can see an example that copies conditional formatting from one column to the rest:
The code for this particular example can be found here. In this article we’ll discuss more broadly how we can author such scripts by diving into a different use case.
The potential for scripting in the report layer
Most Power BI developers will agree that developing a good-looking report often involves a great deal of clicking around the format pane. Even when you have a curated custom theme (which you should), there are some operations that involve a lot of clicks, like setting up the same conditional format for all fields in a wide table, hence the example we saw above.
There are some use cases that require modifying both the model and the report layer. For example, after creating those referential integrity measures mentioned above, it would be great if the script continued to configure a page to identify exactly the offending values. Luckily, these two scripts (and some others) already exist, but there are many more use cases. But how do these scripts work? Well, they modify the files in the report metadata that have the new PBIR format. Let’s see this in detail.
For convenience, this video walks you through the whole process, end-to-end. It shows an example of how you can script the report and the model at the same time:
Everything in the video is explained in the following article.
What is PBIR and how can you modify it?
PBIR is a new format that can be used for Power BI reports. Going in detail on the PBIR format is beyond the scope of this article, but it’s sufficient to know that it splits all the elements of the report into smaller JSON files. Most of the definitions of the report are stored in visual.json files, one for each visual object. Even though there are a few other files, any configuration you do to your visual most likely will be reflected in the corresponding visual.json file. You can modify the files manually, but that is time-consuming and not easy. C# Scripting can help you make such modifications at speed. But there are certain challenges to overcome.
Where are the report files?
Being able to script the report layer is great, but scripting the PBIR format is complex. For starters, Tabular Editor works connected to a model, but even when you want to modify the report attached to that model in the same PBIP project, there’s no way to automatically find it in the computer, you need to point the script to it. Since PBIR does follow always the same structure, one possible implementation is to point to the definition.pbir file (a very small file at the root of the report definition folder) and from there the script can find all the other relevant files. Now, pointing every time to the same file when you are developing a script is a pain, so that’s why there’s a recent file list like you saw in the video earlier in this article. In the next section, we’ll explain further how to leverage this and other generic functionality in your scripts.
How do you modify JSON files with C#?
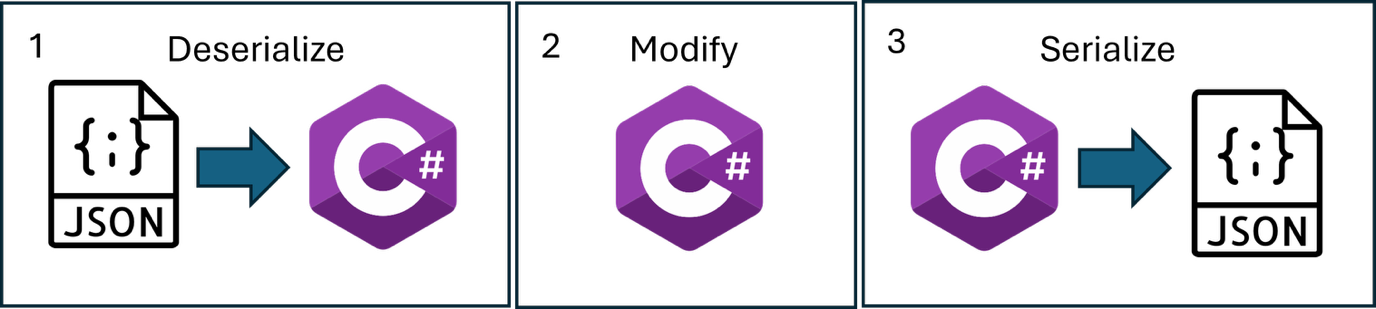
Next problem you will face is how to deal with the JSON files. In C# you can define objects, and crucially there’s already a native functionality that will convert a JSON file into an object and vice versa. Converting a JSON into a C# object is called deserialization, and converting C# Object into a JSON file is called serialization. Thus, the strategy is first to deserialize all JSON files into an object that is convenient, do the necessary modifications, and serialize again all the files that have been modified.
Of course, the way you define that object must match what will come in the JSON file. And here is where things get tricky. Even though the schema of these files is technically public, it is so complex (and spread around so many places) that it is very challenging to create a class that accounts for all possible visual object definitions. For the use case, we will leverage a public repository that can be leveraged as a starting point.
Once you have the JSON file parsed into a C# object, you can do things with it, like you can do with the model.
NOTE
The sheer complexity of the objects means that the C# version that is used in Tabular Editor 2 is inadequate. Luckily enough, it’s possible to configure a different compiler and use more advanced expressions in the code. In Tabular Editor 3 there’s no need for extra configuration.
To save or not to save?
With Power BI Desktop open, when you change the visual.json files of the PBIR report format, it doesn't instantly change the report you see. To avoid confusion on when to save or not when closing Power BI Desktop, the safest way forward is to:
- Save your work and close Power BI Desktop before running the script.
- Open the model in Tabular Editor directly from model.bim or TMDL and execute the script.
- After the script completes, you can open Power BI Desktop to see the changes in the report.
Last but not least, since we are already using PBIP format, make sure you initialize the local Git repository and commit any changes before executing scripts. That’s the best way to double check that the changes are what you wanted, and the easiest way to go back if something unexpected happens. This is true for any script, but even more so for scripts that modify the report layer. While modifications to the model can be undone with Ctrl+Z, that’s not the case with the modifications on the PBIR files.
TIP
When executing scripts, and especially when executing scripts that modify the report layer, make sure to check the changes in Git
Use case: Store and Apply Custom Display Names
To showcase what was described in the previous sections, let’s dive into the following use case: Sometimes in the report we want to use display names that are different from the actual names of measures and columns. This can be due to a number of reasons, such as we want to display different measures with the same name, or in the model we need a long name to clarify what it is, but we don’t need so much information in the visual object.
The way that we would normally proceed would be to manually configure the names we want in one visual object, only to realize we need to replicate those names in other parts of the report. It would be great if we could store the display names somewhere in the properties of the column or measure, and then apply these names wherever needed. Well, now we can. Let’s do it. We will create one script to store the display names from one or more visuals and one script to apply them to one or more visuals.
NOTE
For this use case, we will use the code authoring setup introduced in this blog post. This solution contains classes with general functions, report deserialization, and report manipulation. The setup includes a macro to copy any of the scripts defined in Visual Studio or VS Code to Tabular Editor. It will append the custom classes that are necessary to run the script and other small modifications.
Store the display names
For this use case, we will need to work both with the report and the model. The script will run while connected with the model, so there’s nothing we need to do on that front. For the report, though, we will need to select it so that the script can deserialize JSON files into a more manageable C# object.
We are going to use the methods of the class GeneralFunctions and those of ReportFunctions. To flag this dependency when authoring the code in Visual Studio or VS Code we need to include these two comments at the top of the method:
//using GeneralFunctions;
//using Report.DTO;
These two comments will be removed by the macro that copies the code to be pasted in Tabular Editor, and it is specific to the authoring setup that we are using. They are the flag that will make the macro retrieve the code of the custom classes and append it at the end of the script.
The initialization of the report is always the same, and we can leverage a method already defined in the ReportFunctions class. This method parses pages.json, all the page.json files, all the visual.json files, and organizes all the objects inside a large Report object. It also contains all the dialog boxes to select a recent report or select a new one.
// Step 1: Initialize report
ReportExtended report = Rx.InitReport();
if (report == null) return;
Next, we can let the user select one or more visuals of the report that will be used as a source to import any custom display name configured in them.
// Step 2: Let user select visuals
IList<VisualExtended> selectedVisuals = Rx.SelectVisuals(report);
if (selectedVisuals == null || selectedVisuals.Count == 0)
{
    Info("No visuals selected.");
    return;
}
TIP
It is considered the best practice to avoid unhandled exceptions. Whenever there’s user interaction, consider that the user may close the dialog box without making a valid selection. It’s a good idea to always check and if the object was not initialized, then inform the user and abort execution. Rx.InitReport already has the message in the code, so it’s only necessary to abort execution. If execution continues, it means that all variables have been correctly initialized.
Once we reach this point, it’s time to iterate the selected visuals and see if the fields have a custom name defined in them. First, we need to look at the actual JSON file to figure out where this information can be found.
{
  "$schema": "https://developer...",
  "name": "5715...",
  "position": {...},
  "visual": {
    "visualType": "clusteredColumnChart",
    "query": {
      "queryState": {
        "Category": {
          "projections": [...]
        },
        "Y": {
          "projections": [...]
        }
      }
    },
    "objects": {...},
    "drillFilterOtherVisuals": true
  }
}
The fields that build a visual are inside these different queryState elements, “Category”, “Y” (other types exist in different visuals). They all have similar contents. They can be either “Projections” or “Field Parameters”. For our use case, we do not care about Field Parameters. So, to iterate for all possible projections we can write the following code:
foreach (var visual in selectedVisuals)
{
    var queryState = visual.Content?.Visual?.Query?.QueryState;
    if (queryState == null) continue;

    // Create list of all projection sets to iterate
    var projectionSets = new List<VisualDto.ProjectionsSet>
    {
        queryState.Values,
        queryState.Y,
        queryState.Y2,
        queryState.Category,
        queryState.Series,
        queryState.Data,
        queryState.Rows
    };

    // Iterate through each projection set
    foreach (var projectionSet in projectionSets)
    {
foreach (var projection in projectionSet.Projections)
{ ... }
    }
}
NOTE
The question marks in the member access expressions are not possible with the default C# version used by Tabular Editor 2 and the alternative syntax is extremely verbose. To execute scripts containing such expressions you will need to configure Roslyn compiler as explained earlier in the article or execute the script in Tabular Editor 3.
Projections can be either a “Field” or a “Visual Calc”. We only care about fields because they are the ones that exist in the model and can be reused in different visuals. For each field we want to see if they have a configured displayName and if so, we will use the “Entity” and “Property” (i.e., the table and field name) to go to the model and store the display name there.
{
  "field": {
    "Measure": {
      "Expression": {
        "SourceRef": {
          "Entity": "Sales"  <-------- Table Name
        }
      },
      "Property": "Sales Amount" <---- Measure Name
    }
  },
  "queryRef": "Sales.Sales Amount",
  "nativeQueryRef": "Sales",
  "displayName": "Sales"  <---------- Display Name
}
At this point, the code gets a bit more involved. The script first creates a structure that stores all possible display names found for each field, because the code allows selecting more than one visual object for analysis. Then if more than one different display name has been found for the same field, the macro requires the user to choose the display name that will be stored.
Once we have a clean list of key-value pairs (field – display name) the script finally stores the chosen display name in the model, as an annotation:
foreach (var kvp in measureDisplayNames)
{
    var measure = Model.AllMeasures.FirstOrDefault(
        m => m.Table.DaxObjectFullName + m.DaxObjectFullName == kvp.Key);
    if (measure != null)
    {
        if (measure.GetAnnotation("DisplayName") == kvp.Value) continue;

        measure.SetAnnotation("DisplayName", kvp.Value);
        measuresUpdated++;
    }
}
Annotations are a great place to store extra information on any element of the model, like the display name in this script. Annotations have no functional effect on any model behavior but rather a convenient place for metadata.
Once the script is executed, it is recommended to save the changes in the model so that these display names are available in the future to apply to any report tied to it.
NOTE
The script will execute whether the report is connected to the model or not, but using a report not connected to the model may lead to unexpected results
Here you can find the script. Let’s see it in action:
Applying the display names
Let’s see how we can build the second script. Like in the previous one, we will need to point to the report that needs to be modified. If it’s the same report, it will display at the top of the list of latest reports in the file picker, so you can just click the OK button.
The code is very similar until we reach the iteration for each of the projections. Here is where it checks if the field in the model and in the report has a display name configured. In case it finds a display name annotation in the model and no custom display name defined in the visual, or has different one, it will apply to the visual object the stored display name from the model.
if (projection?.Field == null) continue;

string displayNameFromModel = null;

// Check if it's a measure
if (projection.Field.Measure != null)
{
    var measureExpr = projection.Field.Measure;
    if (measureExpr.Expression?.SourceRef?.Entity != null
        && measureExpr.Property != null)
    {
        string fullName = String.Format(
            "'{0}'[{1}]",
            measureExpr.Expression.SourceRef.Entity,
            measureExpr.Property);

        var measure = Model.AllMeasures.FirstOrDefault(
            m => m.Table.DaxObjectFullName
                + m.DaxObjectFullName == fullName);

        if (measure != null)
        {
            displayNameFromModel =
                measure.GetAnnotation("DisplayName");
        }
    }
}
// Check if it's a column
else if (projection.Field.Column != null)
{  ... }

// Apply display name if found in model
if (!string.IsNullOrEmpty(displayNameFromModel))
{
    // Check if projection already has a display name
    if (string.IsNullOrEmpty(projection.DisplayName)
        || projection.DisplayName != displayNameFromModel)
    {
        projection.DisplayName = displayNameFromModel;
        updatedCount++;
        visualModified = true;
    }
}
This is the code executed while iterating for each type of projection of a single visual. Here it is important to flag if any change was made to the visual at all. This is achieved with the visualModified = true statement. Then after iterating all the projections of a single visual this code is executed:
// Save visual if it was modified
if (visualModified)
{
    Rx.SaveVisual(visual);
    visualsUpdated++;
}
Again, here we are leveraging a method defined in Report Functions class that contains the necessary code to serialize again the contents of the C# object into the visual.json file. Here we can keep track of how many visual objects were modified to inform the user at the end.
Check out the full script here. And let’s see it in action:
This is just one simple example of reading and using information from the PBIR in a C# script. There’s a lot more that you can do, including finding and replacing fields, automating formatting changes, and more.
For further reading
- Hidden secrets in the Power BI report metadata (tabulareditor.com). Tours the PBIR visual.json structure this article scripts against, so you know what the deserialized objects actually contain before you modify them.
- Power BI Desktop project report folder (PBIR format) (Microsoft Learn). The official spec for the PBIR folder layout,
definition.pbirfile, and JSON schemas your script must point to and respect when editing visuals. - C# Scripts in Tabular Editor (docs.tabulareditor.com). Reference for the C# scripting engine and the Model/Selected objects the script uses to read fields and write the
DisplayNameannotations.
In conclusion
Now that PBIR is available, Tabular Editor C# Scripts are no longer limited to modifications on the model. At the same time, modifications to the report are not without risk, and should always be made paying attention to the changes shown in Git.
Authoring scripts for the report layer is complex, and for this reason it is recommended to use a coding environment like the one used in the use case to enjoy the benefits of a code IDE and be able to easily reuse code between scripts.
Try C# scripts in Tabular Editor 3 for next-level automation.
Give Tabular Editor a spin