
Key takeaways
- Centralize visual calculation logic: DAX User-Defined Functions are a good way to centralize the logic of visual calculations and persist it in the model.
- Visual-calc functions work inside UDFs: DAX functions specific to visual calculations can be used inside DAX UDFs and work when called from a visual calculation.
- Parameter passing mode matters: The parameter passing mode is important when you use parameters inside expressions that modify the visual context of evaluation.
This summary is produced by the author, and not by AI.
DAX UDFs to reuse visual calculations
DAX User-Defined Functions (DAX UDFs) together with Visual Calculations have been two recent important new features for those working with DAX. Visual Calculations came first, and one of the downsides that were more often called out is that they were defined at the visual level, and as such, it was not possible to reuse the logic across visuals or reports. DAX UDFs were introduced in September 2025 and enable the encapsulation of DAX logic, including DAX that can only be used in visual calculations. It is now possible, therefore, to centralize the logic of visual calculations in DAX UDFs.
In this article, we will illustrate how to solve a use case with Visual Calculations and then how to move that logic to DAX UDFs so it can be reused in other visuals. Overall, it’s a rather straightforward process, but as is often the case, there are a few details that you need to be aware of.
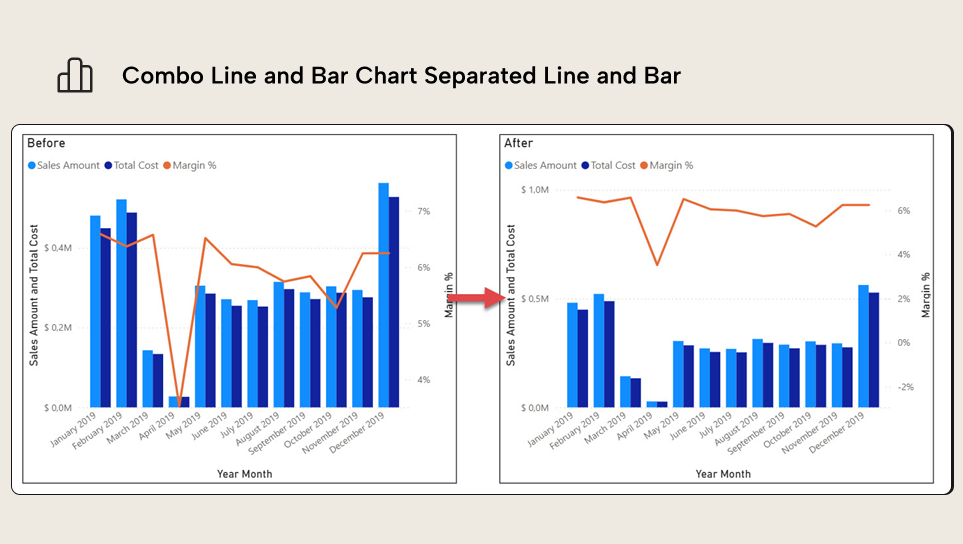
Axis configuration: Make the line of a combo chart always go above the columns
There are cases in which we want to adjust the axis maximum and minimum values to make our chart easier to understand. In most cases, it’s not possible to hardcode the values because we need them to be dynamic. For a long time, it’s been possible to tie the value to a measure. However, we may not want to create such one-off measures that lack any analytical value in our semantic model. This is where visual calculations shine. For such calculations, all the data we need is already in the visual, and the DAX is much easier, as we do not need to consider shadow filter context and similar factors.
By tying the maximum and minimum values of the axis to visual calculations, we want to achieve the following:
The first important detail that we need to be aware of is that for the axis or titles, when tied to a visual calculation, the value used is the value in the grand total row. To achieve the desired value in that row, we may need to modify the Visual Context of the calculation, using COLLAPSE or EXPAND functions (you can read more about it here).
NOTE
When creating a visual calculation to define an axis maximum or minimum value, the value used will be the one in the grand total.
General considerations on the use case
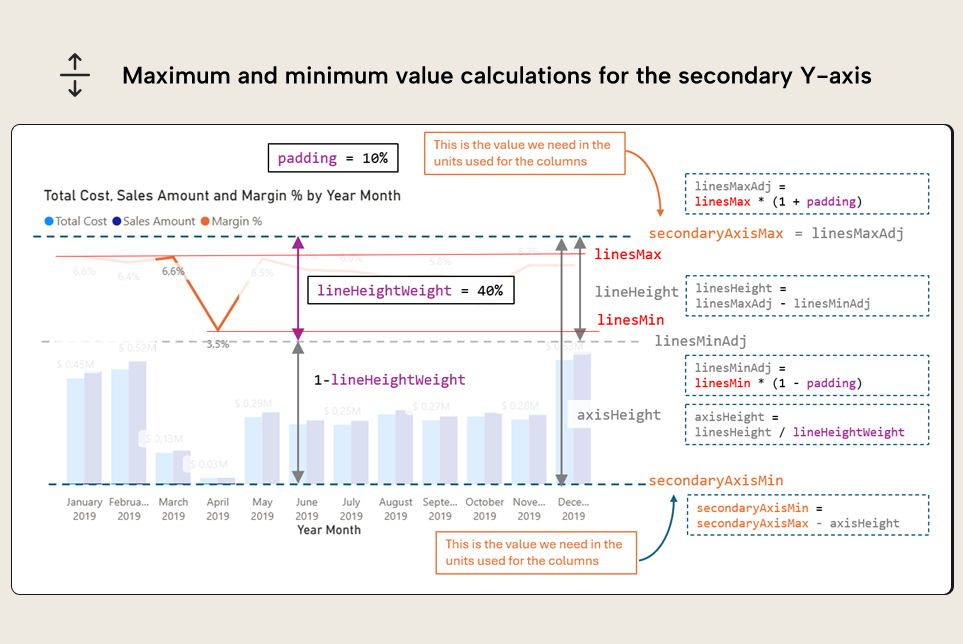
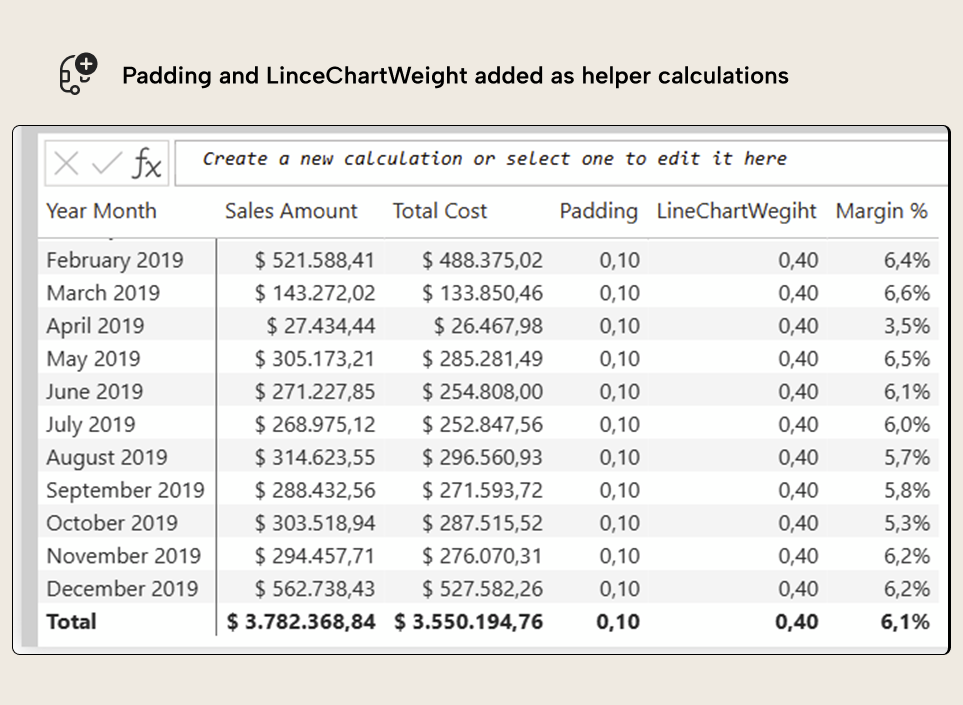
To ensure the line always appears above the columns in a combo chart, we need to modify the maximum of the main Y-axis and the maximum and minimum values of the secondary Y-axis. To achieve this, we will also need two additional parameters that will be used in two or more of these visual calculations: one to add some padding around the maximum and minimum values found in the chart, and one to define the percentage of the vertical axis that corresponds to the line chart. These two parameters could be hard-coded in each calculation, but that would make maintenance difficult. A better approach is to create hidden visual calculations with these values hard-coded, so that they can be reused in the 3 visual calculations we want to make. If these configuration values need to be centralized, the two parameters can be added to the visual as regular measures and then hidden once the first visual calculation has been created.
The visual calculations are not extremely difficult, but do require some thought. To make things a bit easier, these two images will help us figure out the DAX expressions. For illustrative purposes, we are considering a use case where all values are positive. This implementation can be improved to have more proportional padding and accommodate negative values, but for the sake of clarity, we have kept the example as simple as possible.

All visual calculations will be created as hidden, as we only want to use them for the axis configuration. By default, they are created as visible, so we will need to hide them by clicking on the little eye icon next to the field name in the Visualization pane visible when we are editing visual calculations.
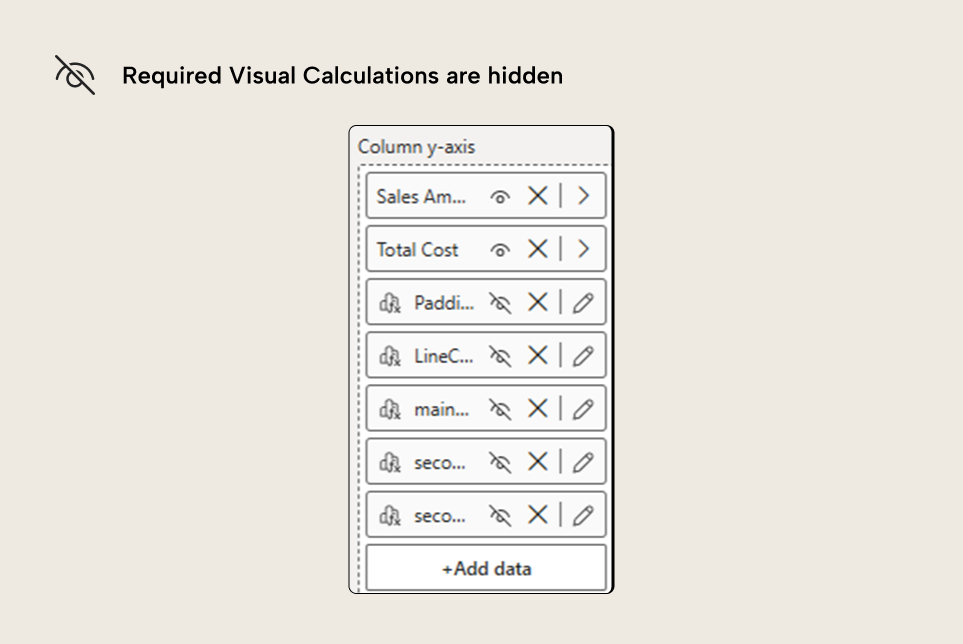
Adding hidden parameters to reuse across visual calculations
As stated in the previous section, we add two hidden visual calculations or measures with the padding percent value and the linechartWeight value. Like this:
Maximum of the main axis visual calculation
Adding hidden parameters was the easy part. Now let’s do the mainAxisMax. To calculate it, we will first have to get the maximum value of any of the columns (columnsMax in the image). Next, we will need to expand it a little bit for some breathing room between the columns and the line chart area (columnsMaxAdj), and finally, we will need to add all the space allocated for the line chart, expressed as a percentage of the total chart height. This returns the maximum value to use for the axis (mainAxisMax).
A Visual Calculations implementation looks like this:
mainAxisMax =
VAR columnsMax =
    CALCULATE (
        MAXX (
            ROWS,
            MAX (
                [Sales Amount],
                [Total Cost]
            )
        ),
        EXPANDALL ( ROWS )
    )
VAR columnsMaxAdj = columnsMax * ( 1 + [Padding] )
VAR mainAxisMax = columnsMaxAdj / ( 1 - [LineChartWeight] )
RETURN
    mainAxisMax
The key to this calculation is to use EXPANDALL in the columnsMax value to get row max specifically in the grand total row. Using EXPANDALL instead of EXPAND means that the maximum at the grand total is over the combination of all the fields used for rows. For a single column, there’s no difference, but if we used year and month, at the grand total, we would get the max across years, instead of the max across year and months, which is what we need for this use case. As a bonus, this calculation doesn't reference the fields used for rows at all, so it will work even if you change the granularity of the chart with a field parameter.
NOTE
Visual calcs always consider all the fields added to the visual, regardless of the drill-up drill-down state of the chart. So, if the months are collapsed and the chart is shown at the year level, the grand total of the visual calculation will not change, and line will not be above the columns anymore. When swapping multiple fields with a field parameter, by default they will display collapsed, so this could lead to unexpected behavior.
Now, by clicking on the fx button of the axis maximum, you can bind the value to the visual calculation, and it will take the value on the grand total.

Maximum of the secondary axis visual calculation
The maximum of the line chart is possibly the easiest one, as we just need to take care of a little bit of padding (and even that can be optional).
secondaryAxisMax =
VAR lineMax =
    CALCULATE (
        MAXX (
            ROWS,
            [Margin %]
        ),
        EXPANDALL ( ROWS )
    )
VAR lineMaxAdj = lineMax * ( 1 + [Padding] )
RETURN
    lineMaxAdj
Minimum of the secondary axis visual calculation
Now the trickiest of all three is the secondary axis minimum. For that, we will need to calculate the actual height of the line chart area, then calculate the height of the entire secondary axis using the lineChartWeight parameter and finally subtract it from the axis maximum to find the axis minimum. We could reuse the visual calculation of the secondary axis max, but we can also recalculate it with the same expression and keep them independent and also a bit easier to understand.
secondaryAxisMin =
VAR LineMax =
    CALCULATE (
        MAXX (
            ROWS,
            [Margin %]
        ),
        EXPANDALL ( ROWS )
    )
VAR LineMaxAdj = LineMax * ( 1 + [Padding] )
VAR LineMin =
    CALCULATE (
        MINX (
            ROWS,
            [Margin %]
        ),
        EXPANDALL ( ROWS )
    )
VAR LineMinAdj = LineMin * ( 1 - [Padding] )
VAR LineHeight = LineMaxAdj - LineMinAdj
VAR SecondaryAxisHeight = LineHeight / [LineChartWeight]
VAR SecondaryAxisMin = LineMaxAdj - SecondaryAxisHeight
RETURN
    SecondaryAxisMin
If we now bind the secondary axis maximum and minimum values to the hidden visual calculations, we should see something like this:
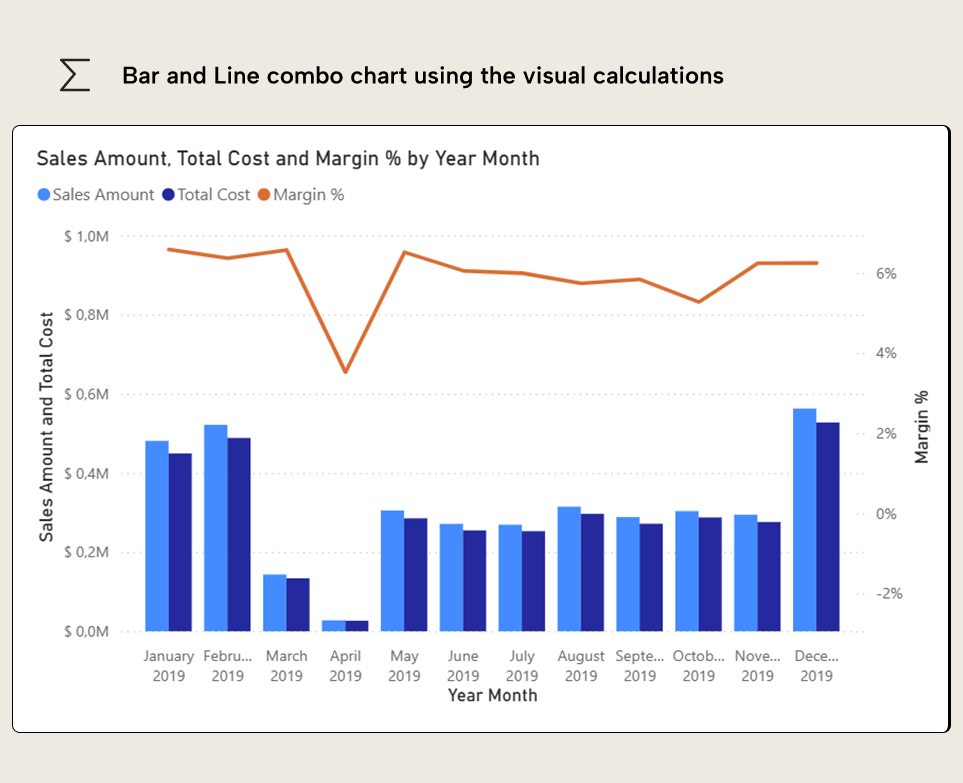
At least for the line, it is strongly recommended to add data labels and hide the secondary axis values and title.
Converting visual calculations into DAX UDFs
The results look great, but what happens if we want to replicate the same effect elsewhere in the report, or even in a separate report? Here is where DAX UDFs come in. To create a DAX UDF, you can do it through the Model View, DAX Query View, TMDL View, and of course, from Tabular Editor. Once the function is created, it can be called from anywhere DAX is used in that model or, in the case of visual calculations, any report connected to that model. As you should expect, if the function contains expressions that can only be used in Visual Calculations, calling it from other places will result in an error. DAX UDFs can be copied to other semantic models and will work if there are no explicit references to the model or visual calculation names.
When creating any DAX UDF, you need to give it a name, specify the parameters, and then provide the expression that will be calculated. For DAX UDFs of Visual Calculations, there is no difference. For the logic of the mainAxisMax visual calculation in a DAX UDF would become something like this:
 PrimaryAxisMax = (
        maxColumnExpression : EXPR,
        padding,
        lineChartWeight
    ) =>
    VAR ColumnsMax =
        CALCULATE (
            MAXX (
                ROWS,
                maxColumnExpression
            ),
            EXPANDALL ( ROWS )
        )
    VAR ColumnsMaxAdj = ColumnsMax * ( 1 + padding )
    VAR MainAxisMax = ColumnsMaxAdj / ( 1 - lineChartWeight )
    RETURN
        MainAxisMax
And the call from the visual calculation to the DAX UDF would look like this:
mainAxisMax2 =
PrimaryAxisMax (
    MAX (
        [Sales Amount],
        [Total Cost]
    ),
    [Padding],
    [LineChartWeight]
)
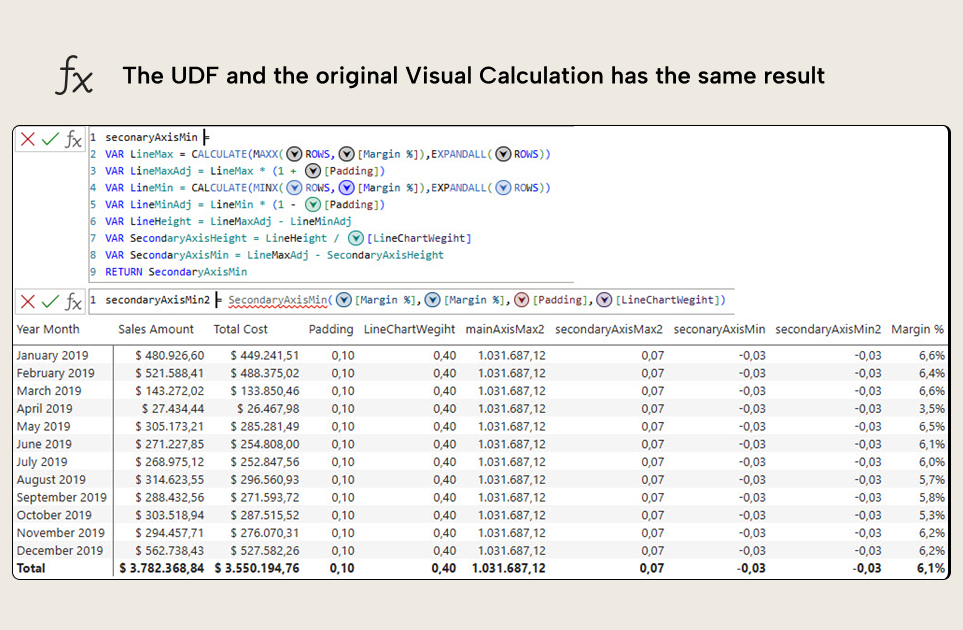
Sure enough, both visual calculations return the same values:
NOTE
In the November 2025 version of Power BI Desktop, IntelliSense still doesn't recognize DAX UDFs in Visual Calculations nor Visual Calculation functions in DAX UDFs, but it’s valid syntax and works as expected.
The DAX UDF expression is indeed very close to the original visual calculation one, but there are a few aspects to discuss.
The first option is to avoid creating two arguments to pass Sales Amount and Total Cost measures (such as visualColumn1 and visualColumn2, for example, as they are no longer measures). Instead, the choice was made to pass an expression that already returns the maximum of the two. The reason for that is that we might want to use this DAX UDF in slightly different scenarios when we have a different number of visual columns. Since at the time of this writing, there’s no possibility of passing a variable number of arguments to DAX UDFs, this is the most reasonable workaround. You can either create a visual calculation precalculating this maximum by row or do it directly as an expression. The most compact way to calculate the maximum of three or more numbers is using an anonymous table like:
MAXX (
    {
        [a],
        [b],
        [c]
    },
    [Value]
)
The second detail to consider is that the maxColumnExpression needs to be an argument of expr passing mode. This indicates that the value will be evaluated within the expression in which it is used, rather than being passed as a static value. This is what would happen if we did not specify anything at all, so it’s something we should not forget.
NOTE
Any parameter used inside the compute expression of CALCULATE in a DAX UDF needs to have expr passing mode. This is true for Visual Calculations and regular DAX. It also applies to other functions that use CALCULATE under the hood, such as COLLAPSE and EXPAND when they are not used as CALCULATE modifiers (read more here).
The logic for secondaryAxisMax visual calculation is quite simple and results in a rather straightforward DAX UDF:
 SecondaryAxisMax = (
        lineMaxExpression : EXPR,
        padding
    ) =>
    VAR lineMax =
        CALCULATE (
            MAXX (
                ROWS,
                lineMaxExpression
            ),
            EXPANDALL ( ROWS )
        )
    VAR lineMaxAdj = lineMax * ( 1 + padding )
    RETURN
        lineMaxAdj
They both return the same values as well:
Here, the only element worth mentioning is that we could have more than one line in the chart as well, so we will need to pass an expression returning the maximum value of them all for each row of the visual matrix.
Now for the secondaryAxisMin, the original visual calculation was more intricate, and of course, results in a more intricate DAX UDF, which looks like this:
 SecondaryAxisMin = (
        lineMaxExpression : EXPR,
        lineMinExpression : EXPR,
        padding,
        lineChartWeight
    ) =>
    VAR LineMax =
        CALCULATE (
            MAXX (
                ROWS,
                lineMaxExpression
            ),
            EXPANDALL ( ROWS )
        )
    VAR LineMaxAdj = LineMax * ( 1 + padding )
    VAR LineMin =
        CALCULATE (
            MINX (
                ROWS,
                lineMinExpression
            ),
            EXPANDALL ( ROWS )
        )
    VAR LineMinAdj = LineMin * ( 1 - padding )
    VAR LineHeight = LineMaxAdj - LineMinAdj
    VAR SecondaryAxisHeight = LineHeight / lineChartWeight
    VAR SecondaryAxisMin = LineMaxAdj - SecondaryAxisHeight
    RETURN
        SecondaryAxisMin
And yes, they do return the same values:
By now, we have run out of things to point out. Still, we can note that even though a single chart line could be handled with a single argument, if we want the DAX UDF to work with charts that have more than one line, we will need to provide an expression for the maximum and another one for the minimum. Hopefully, a variable number of parameters will be implemented in the future so that these calculations can be encapsulated in the DAX UDF as well.
Note also that for this more complex DAX UDF we have followed the naming conventions of SQLBI of using PascalCase for variables and camelCase for parameters, to make the code more readable.
About visual calculation DAX UDF reusability
From a technical perspective, Visual Calculation DAX UDFs seem to be -by definition- model independent, and thus good candidates for sharing at daxlib.org or in any repository for that purpose. Yet, as explained in this article, references by name also make the function not 100% model independent, and thus, Visual Calculation DAX UDFs that we want to share should not have any direct references to specific visual columns; all column references should be passed through parameters.
However, while all the DAX UDFs on daxlib.org are model-independent, this doesn't mean you can use them all in a visual calculation. Any DAX UDF that expects a measure, a table, or a column from the model to work cannot be called from a visual calculation, as the visual calculation doesn't have access to the model, only the visual.
For further reading
- DAX User Defined Functions (DAX UDFs) for Power BI in simple terms (tabulareditor.com). Grounds the reader in what DAX UDFs are and how they encapsulate reusable logic before applying them to visual calculations.
- 8 tips for writing User-Defined Functions in DAX (tabulareditor.com). Expands on the parameter passing-mode and naming details this article flags as critical when authoring UDFs.
- Using visual calculations (Microsoft Learn). Official reference on visual calculations, including the EXPAND/COLLAPSE axis functions and the grand-total behavior the axis trick depends on.
- Using EXPAND and COLLAPSE in visual calculations (SQLBI). Deep dive on the visual-context functions the article uses to force the right value into the grand-total row for axis binding.
In conclusion
DAX UDFs provide a way to centralize the logic of Visual Calculations in the semantic model. All DAX functions specific to visual calculations can be used in UDFs, making the expressions of visual calculation much more compact.
Also, if they have no direct references to columns of the visual matrix, they can even be reused across different reports and visuals.
Like any other DAX UDF, though, we need to pay attention to the details, such as the passing mode of each parameter, and consider the different scenarios in which the function might be used.
Model reusable DAX UDF logic in Tabular Editor 3 before it reaches reports.
Give Tabular Editor a spin