Key takeaways
- As a complete beginner to Power BI, you might wonder what a semantic model is, how to make your first semantic model, and where it fits into the big picture.
- A semantic model typically contains multiple tables that you connect or link using relationships.
- You can both update and maintain, as well as re-use your semantic model in other projects.
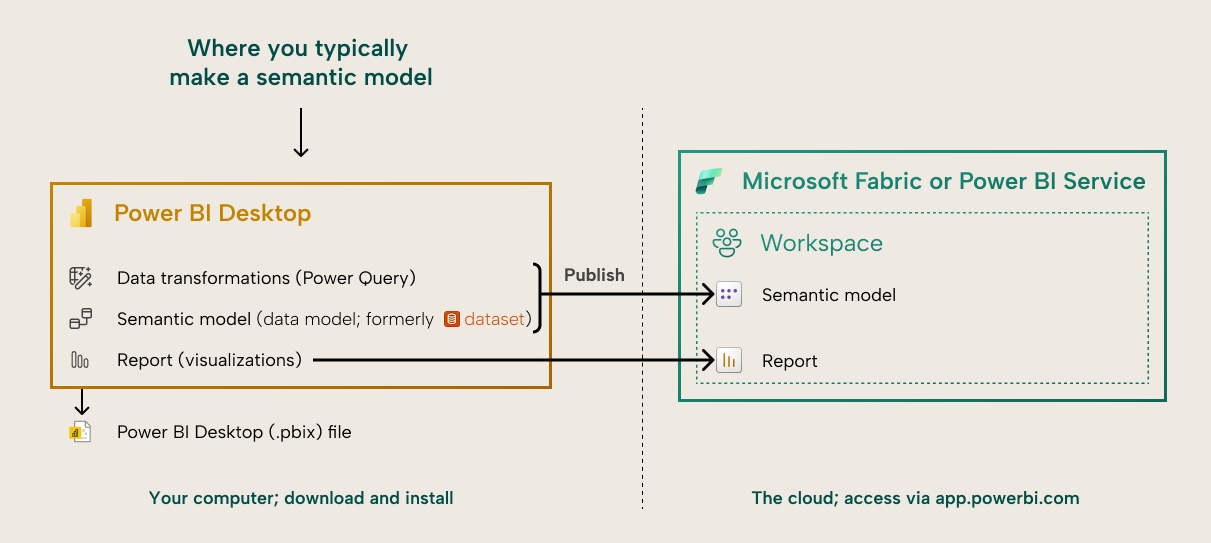
- You typically make the semantic model in Power BI Desktop and publish it to your Fabric or Power BI Workspace.
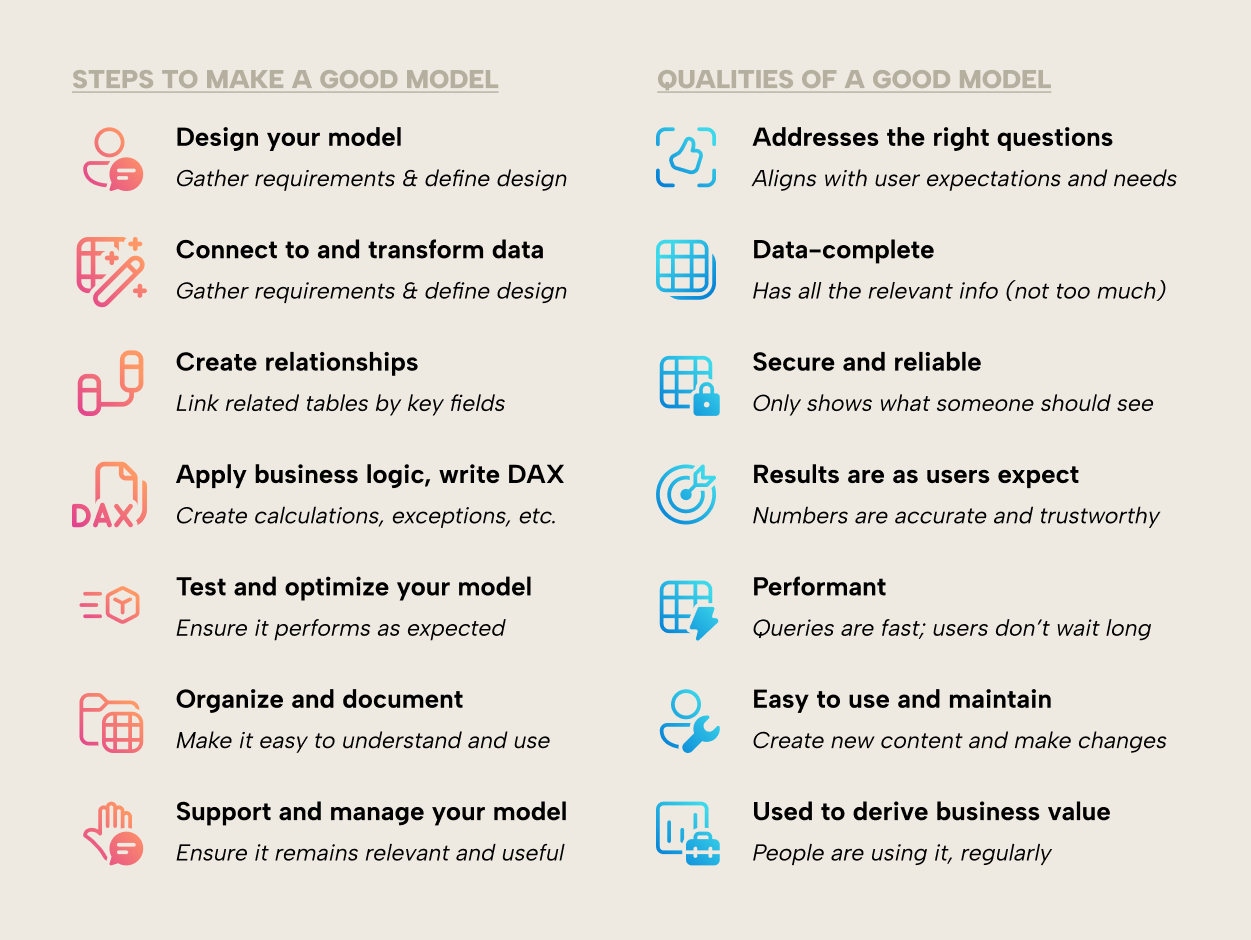
- In this blog, we also provide a list of steps to make a good semantic model and the qualities of a good semantic model.
A semantic model is a structured layer for data that defines tables, relationships, and calculations, so the data is business-ready for use in reports, analyses, or AI tools. The semantic model sits between the data source and reports. It’s also necessary for you to create reports in Power BI; every report has a semantic model that it queries to get data that the report shows in visuals, and functionality like interactive filtering or calculations.
Note: This article is intended for complete beginners to Power BI. If you are looking for a more detailed introduction to semantic models for intermediate and expert analysts or engineers, then see this article.
How do you make a semantic model?
You typically create a semantic model in Power BI Desktop; a Power BI Desktop (.pbix) file contains information for both a semantic model and a report. However, when you publish to the Power BI service, it splits these things up into two separate artifacts:
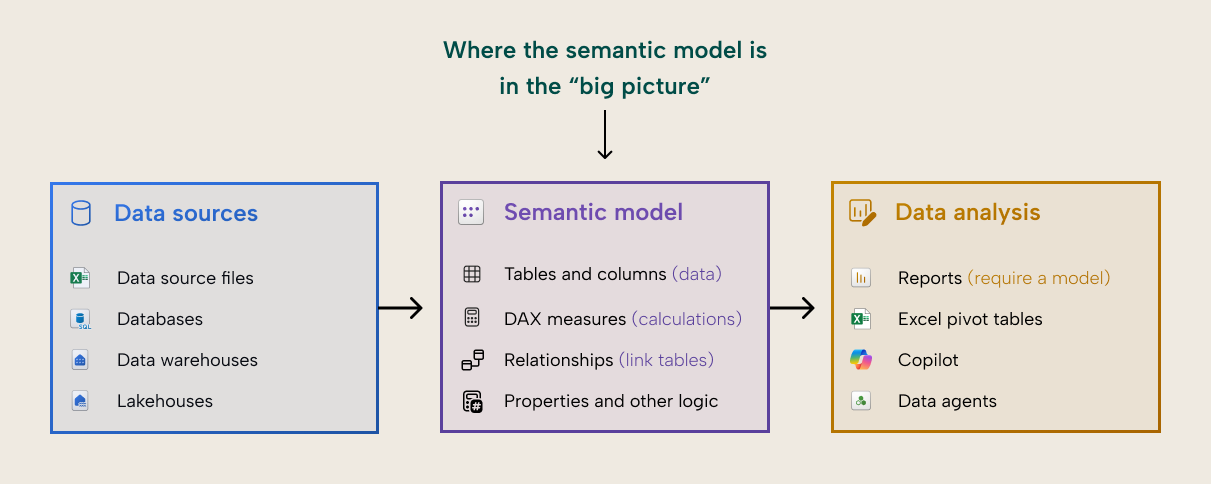
Where is the semantic model in the “big picture” of your data analytics stack?
Semantic models can use many different data sources; in Power BI you can combine data and transform it by using Power Query. You can also use semantic models in many ways to analyse or explore data:
Is a semantic model one big table dataset, or multiple tables that work together?
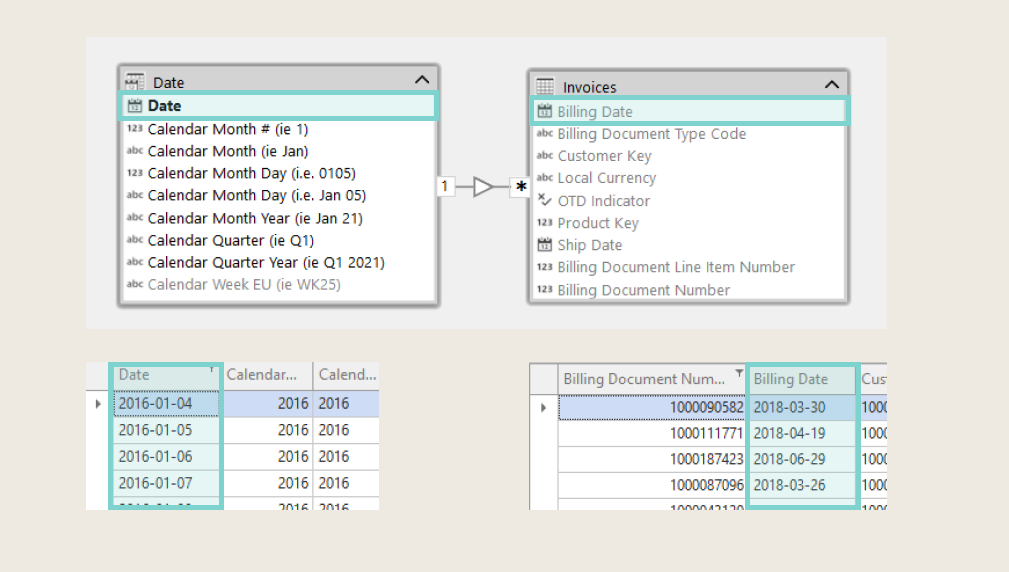
You might see “Tables” in plural and be confused; can’t you just combine all the data into one big table and use that? You can, and that approach works fine for small analyses or some data exploration. However, a semantic model typically contains multiple tables that you connect together by using relationships. Relationships make it possible for you to take a column from one table (like Month in the Date table) and use it to group data from another table (like Sales in the Invoices table) when those two tables are linked by a relationship (like Date → Billing Date):
What is a “star schema”?
The type of model design that works best with Power BI is called a star schema. You don’t have to use a star schema, but most of the time, you will end up with better results that cost less resources, time, and effort to use or maintain with this approach.
Microsoft has a good introduction on their documentation site, Microsoft Learn.
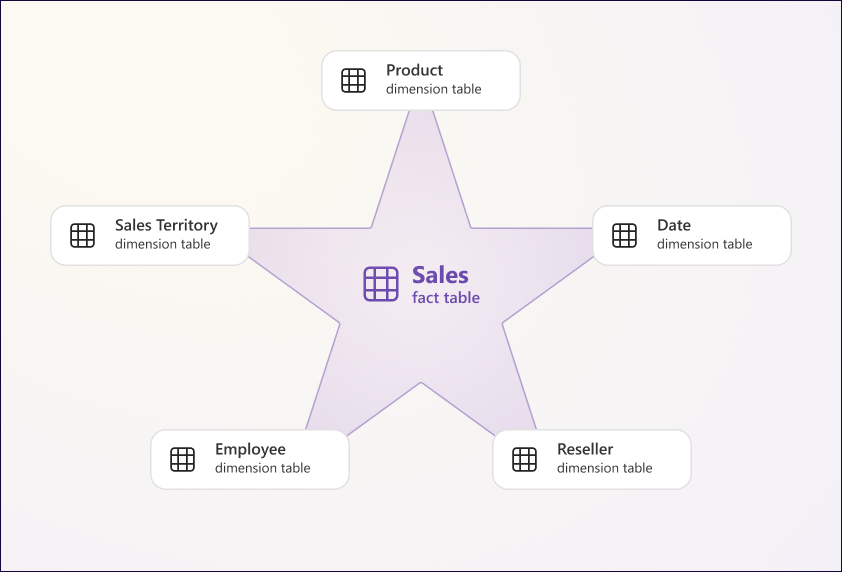
Image from “Understand star schema and the importance for Power BI” by Microsoft.
That article and the Microsoft guidance are recommended reading for anyone just getting started using their data in Power BI, but don’t worry too much about all the technical details. If you’re new to Power BI, we recommend that you focus first on getting business value from the tool, then finding incremental ways to improve your way of working to get more sustainable and scalable success. The Fabric Adoption Roadmap can help you with that (don't worry, it's not Fabric-specific). You might also find the Power BI implementation planning helpful. Again, you don’t have to read all this stuff; just check what you need, when you need it.
Can you automatically update and re-use a semantic model?
Anyway, a semantic model isn’t just a one-off, static dataset that you create for each report. You can use it this way, though in limited scenarios. For example, if you are doing a small or ad hoc analysis, or just exploring some data for yourself. However, typically, a semantic model has two properties that make it very powerful:
- First, a semantic model is regularly updated and maintained. Once you publish the model to a workspace, then you can refresh it to get the latest data, which is then shown in downstream reports and analyses. You can even schedule this refresh so that it happens automatically, without your manual action. This requires that you’re connected to data sources that your model can talk to, not just local files on your computer. To do this, you can store those files in OneDrive, SharePoint, Google Drive, or Fabric OneLake.
- Second, a semantic model can be re-used. You do not have to make a new semantic model to create new reports; if the data and calculations are already in an existing model, then you can just connect to it and re-use it. This can save a lot of time and ensure that reports and analyses are using the same data and definitions. This is why many people will say that a semantic model can be a “single source of truth” (even though that never really happens in the real world, only in the preachy presentations of consultants).
Because you can re-use a semantic model, it means that various people can use it for different things. You don’t have to just use your model to make and share reports; you can also use it for exploring data, you can share it with others to connect to from Power BI and Excel, and you can even set up tools to do advanced analyses in code notebooks or ask questions about your data in natural language by using AI.
Microsoft’s semantic model in Power BI might be the best on the market
The semantic model has a lot of features that help make all of this possible, such as data security, which lets you decide who can see what data, among many others. The semantic model in Power BI is the most feature-rich and complete semantic model in the market. There are other tools that offer similar experiences, including Tableau, Looker (Google Cloud), Microstrategy, Palantir Foundry (Ontology), and more. Each of these tools have their own strengths and weaknesses, and we don’t believe that there is one “best” BI tool. However, we do believe that none of the semantic modeling capabilities in other tools come close to what you can do with a Power BI semantic model, today.
How do you make a semantic model, and what does a good semantic model look like?
However, like any tool, building and using a semantic model properly takes some time and skill. There are a lot of options, steps, and decisions to make as you walk through the process of building a semantic model, and it’s hard to define what a “good semantic model” really means:
Where can you go to learn more?
If you want a practical introduction to semantic models, how to make them, and how Tabular Editor can help you, we cover that in our beginner’s course for Tabular Editor 3. You can find the course at learn.tabulareditor.com. Like all of our articles and trainings, course is free for everyone; no license or cost required. We know how hard it can be to learn and do what you need when working with Power BI – and we hope that we can help.


