
Key takeaways
- A notebook is cells of text and code: Like a document, but with cells that hold markdown or code in languages like Python, R, and T-SQL, all in one shareable workflow.
- Semantic Link connects notebooks to your models: Semantic Link and Semantic Link Labs are libraries that let you read, use, and manage Power BI semantic models from a notebook.
- Power BI people should care: Notebooks let you do things at scale that aren't possible in the Power BI interface, like bulk changes and automated checks.
- It's a supplemental tool, not a replacement: You don't need notebooks for everyday work, but they're powerful for specific tasks when you reach for them.
This summary is produced by the author, and not by AI.
Introduction
In Microsoft Fabric, you can create and use notebooks, which are interactive documents that let you combine code, explanatory text, and visualizations in one place. Notebooks can be very useful. However, let’s first better define what they are and what they do in plain terms before stating why they are useful.
What is a notebook?
Think of a notebook as the following:
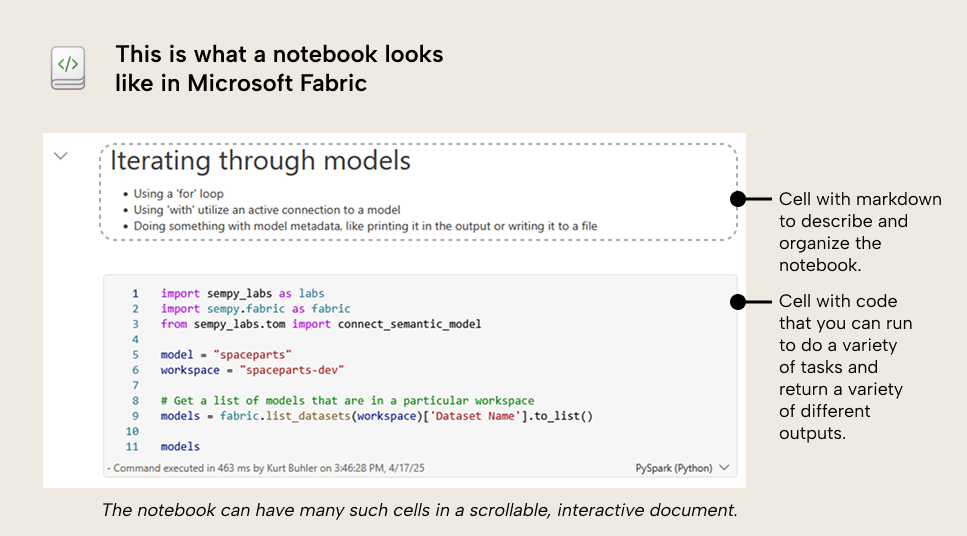
You can think of it like a word document, but instead of pages, you have cells, which hold text or code. It all exists in the same notebook, so it’s easy to see, organize, and share the whole workflow.
A cell can contain markdown to document things, or code to do things.
The code could be in any supported language, including Python, R, and T-SQL. You don’t need to install anything to write and run this code, but you can import and optionally install a variety of libraries to access convenient functions to do interesting and useful things.
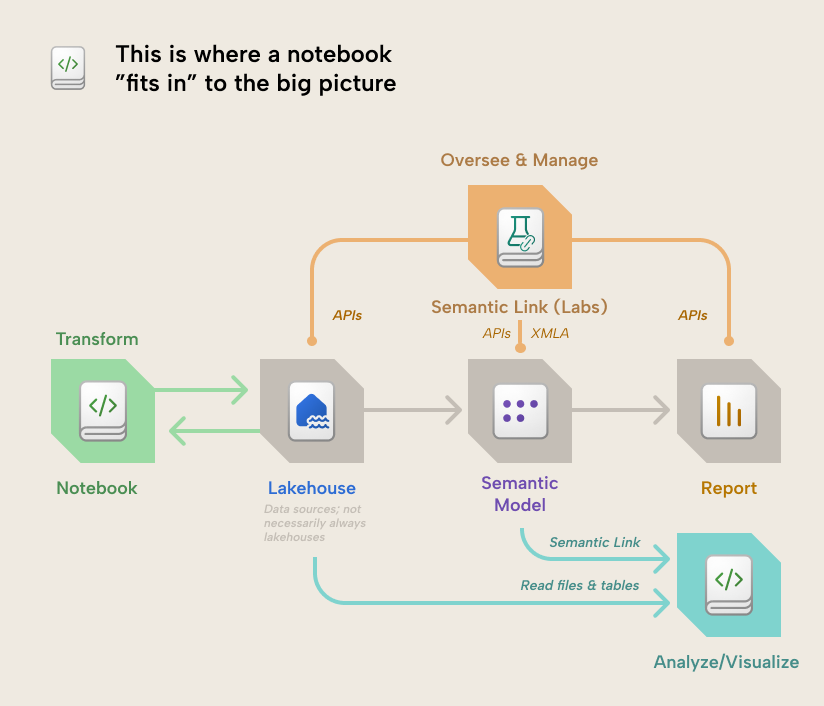
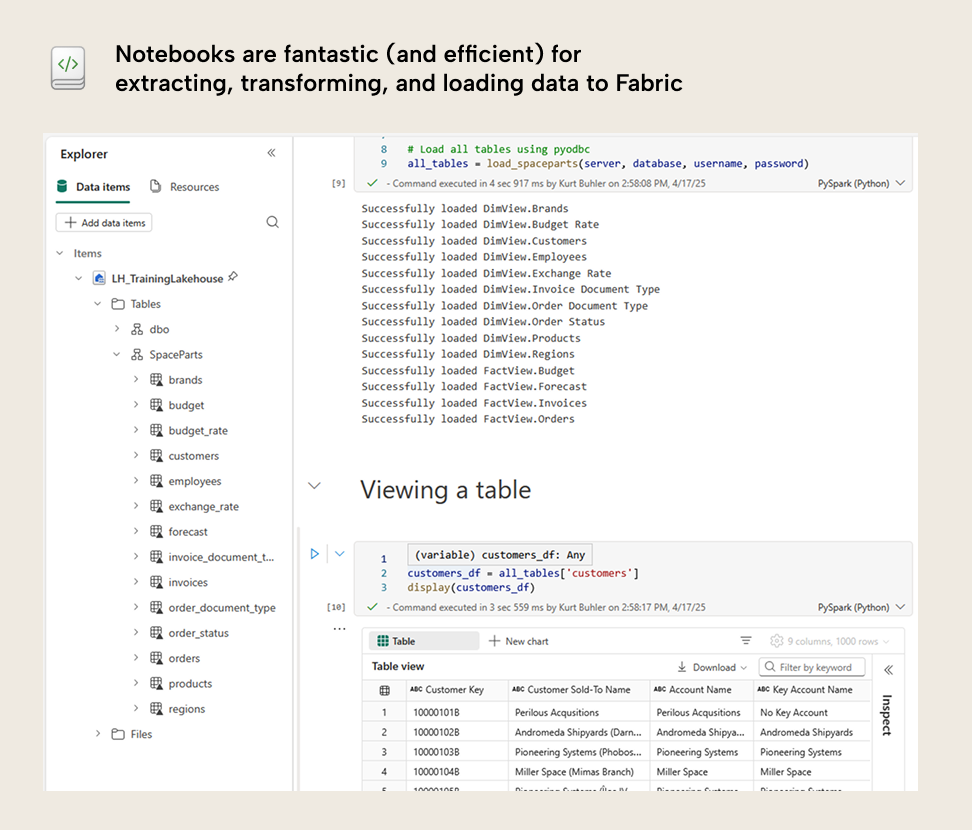
You can write code to extract, transform, load, and analyse data from many sources. It is most convenient to connect to data sources that you have access to in Fabric (including files or tables in OneLake via Lakehouses, data warehouses, and so forth), but also external or public data sources that you can access with code.
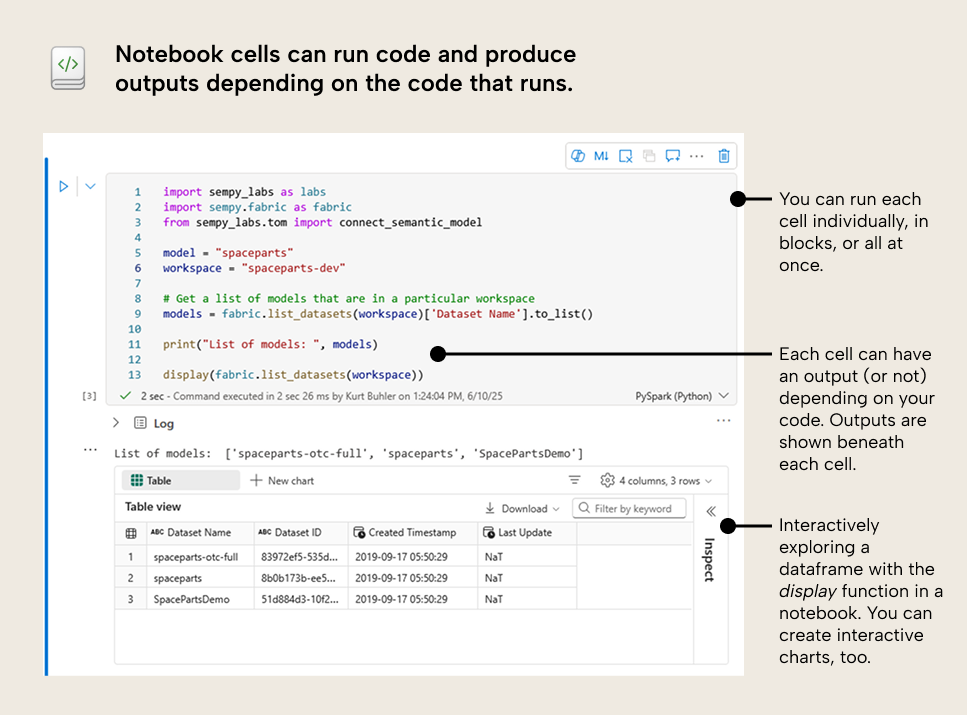
The notebook is interactive, so you can run the code in select cells (or the entire notebook) and see the results for each cell beneath it. Notebook cells can have an output, but they don’t have to; it depends on the code you write. Outputs could be:
- One or more lines of printed text, to notify that something happened.
- A data table (called a DataFrame when working with languages like Python).
- A visualization.
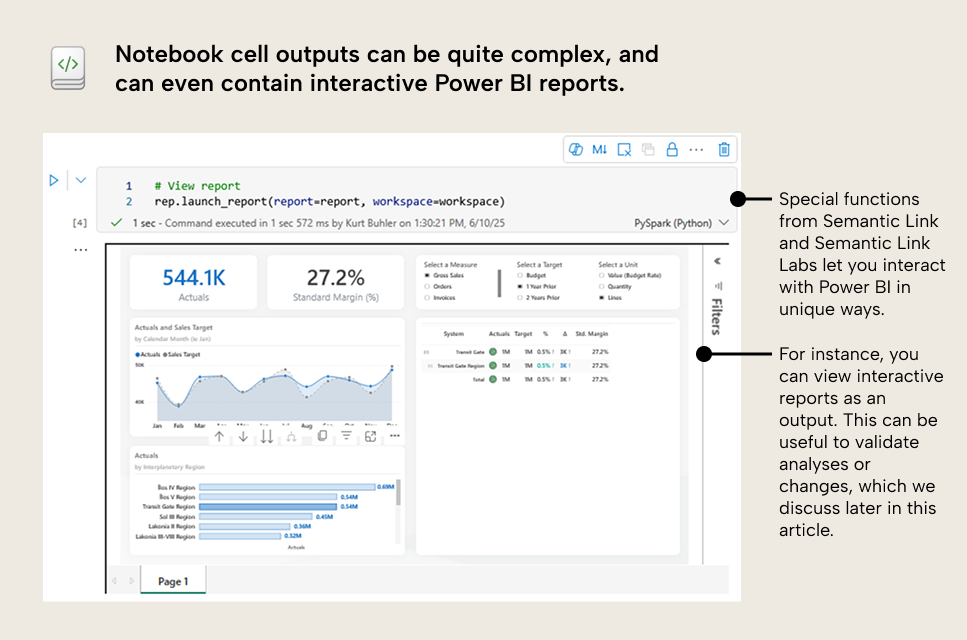
- Other, custom outputs that can also handle user input and themselves be interactive. You can even use Power BI reports inside of notebooks this way.
Notebooks aren’t just for producing visible outputs for data. Many cells can also just be intermediate steps in the code you write, broken out logically into different cells (Rather than one large cell) to make the code easier to debug, manage, and change.
Notebooks can also make changes to data and create new data. A notebook cell can create one or more new tables or files and then write (load) them to a data source in Fabric (like a Lakehouse). You can “attach” a Lakehouse or warehouse to a notebook for more convenient access and simpler referencing in your code.
You can automate notebooks to run on a schedule, like how you set up a scheduled refresh for a Power BI semantic model or a Power BI dataflow (or Fabric dataflow Gen2).
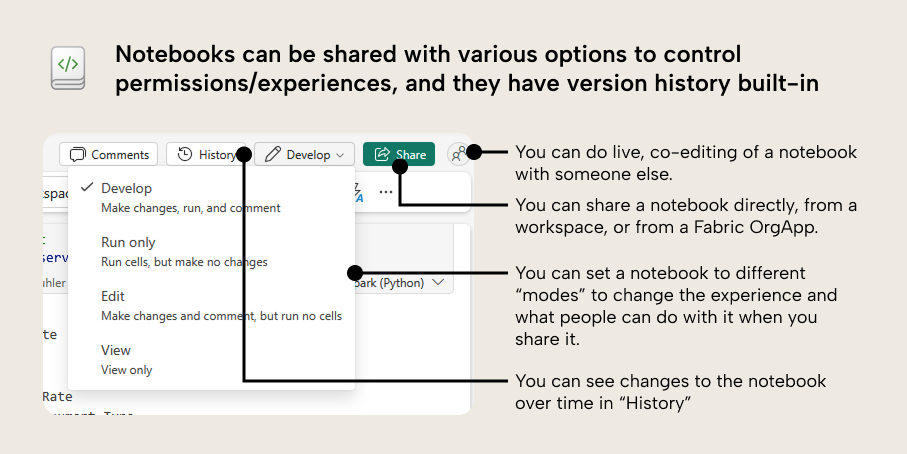
Notebooks have built-in version control (History) to help you track and manage changes. You should still probably use Git integration, if you can, though.
You can share a notebook with other people, either directly, in a Fabric Org App, or via workspace sharing. People you might share a notebook with could include:
- People who have access to the same workspace.
- Peers who want to work on the notebook or use it in some way. You can co-edit in the same notebook at the same time, which is pretty cool (Hey Copilot, why can’t we do this with Power BI reports, yet?).
- Users who want to view the visualizations or analyses that result from your code. You can set your code to “Run only” or “View” to prevent users from changing it.
Fun fact: Computational notebooks share the metaphor of laboratory notebooks in science.
In a laboratory, scientific researchers keep rigorous notebooks documenting their experiments - the intent, hypothesis, methods, and results. When ready, they transform these documented results into figures for scientific papers.
Computational notebooks (which emerged from interactive computing in 1988) serve a similar function for code-based analysis. They became valuable tools in data science and later data engineering. Now, in Microsoft Fabric, notebooks are ubiquitous – anyone can use them, so long as you're willing to brave the "world of code".
So… in a way, we're all becoming more like scientists. Cool, right?
Now we have established what a notebook is: an interactive document for you to write and run code to do a variety of things. But as someone who works with Power BI, why should you care? Especially if you do not know or write code like Spark or Python?
First, we should briefly introduce Semantic Link and Semantic Link Labs.
What are Semantic Link and Semantic Link Labs?
These are libraries from Microsoft that you can only use in Fabric notebooks. These libraries contain functions that make it easier for you to do a variety of things in Fabric and Power BI with your items and data. For instance, you can connect to semantic models (thus the name Semantic Link).
- Semantic Link is the original, official library from Microsoft that contains the core functionality.
- Semantic Link Labs is like an “expansion pack” library that extends Semantic Link and includes many simple and creative functions to do useful things in Power BI. We have Semantic Link Labs thanks to the pioneering effort of Michael Kovalsky, who has delivered a great deal of other useful things to the Power BI community.
We explain more about what you can do with Semantic Link and Semantic Link Labs, below.
Why should a “Power BI person” care about notebooks?
Notebooks help you be productive and do things that you couldn’t do without them. With a notebook, you have more options to solve the problems and annoyances that you’ll face when working with reports and models in Power BI. Ultimately, this can save you time and avoid headaches. But beyond that, notebooks can also open many new possibilities for solving problems that you simply can’t solve with Power BI, alone.
We’re trying to keep this brief, so here’s a list:
- Easier use of the Power BI and Fabric APIs: Before notebooks, if you wanted to do something simple like count the number of reports or models, get model refresh history, or figure out how many people were Exporting to Excel, then you had to use the APIs. That meant that you had to jump through all these technical hoops doing things like app registration and then figure out what endpoints to use, and then send and handle the payloads to get something useful. It was a pain in the ass, especially if you do not have a technical background. Now, with Semantic Link Labs, you can just use one line of Python code to get this information… no special steps or technical backflips through the Azure Portal required… thank god. Here are just a few things you can do with this information:\
- Perform audits of your Power BI tenant.
- Set up automated solutions for monitoring.
- Set up customized solutions for report usage and adoption tracking.\
- Make changes to reports in bulk: Any Power BI developer can tell you from experience that one of the most arduous and painful tasks is when you have to make a lot of formatting changes to reports. Particularly when this formatting isn't driven by design or exploring creativity, but rather by the monotony of making a necessary change in many places. Set column widths. Change font styles. Adjust colours. Position error bars so the bar chart looks like a bullet chart. Never mind when you have to replace fields in reports because they were renamed in the model. This kind of work is frustrating and repetitive. Now, with Semantic Link Labs, you can access and adjust the report metadata to make these repetitious changes, manually. Some lines of Python code, and a few seconds later, it’s all done. I’ve literally seen junior consultants spend more than an entire workweek making these types of changes, and you can now do that work in minutes. I cannot emphasize enough how much time and headache this has saved me, already. Here are some examples of what you can do in multiple visuals and reports at once:\
- Swap fields in visuals.
- Change custom colours or theme colours in visuals.
- Change or remove visual types, images, or formatting.
- Read or write to multiple models or reports at once: As we implied earlier and in other articles, notebooks are powerful because you can scale tasks across many items and workspaces simultaneously. You can iterate through all the models in your workspaces, checking for best practice rule violations, making a change to calculation logic, or querying to get data about model size or data quality. This is very powerful for teams that manage large or chaotic Power BI environments. Here are some examples of what you can do with this:\
- Make one or more changes to multiple models and reports, at once.
- Automate the collection of model or report statistics for governance or adoption purposes.
- Monitor specific individuals or problematic models in detail with automated testing, data collection, and reporting.
- Re-use parts of a model or report: One way to improve the efficiency and quality of your work is to re-use as much as possible. For semantic models, there have already been ways to do this with Tabular Editor C# scripts and DAX scripts, and now the TMDL view. However, notebooks let you take this to the next level, where you can re-use not only parts of a model, but also entire models, visuals, reports, and other Fabric items that you can create and manage from the notebook in code. Here are some examples of what you can do with this:\
- Create and save visual templates that you can re-use and apply to new reports or report pages.
- Create templated solutions (made of multiple item types) to package and deploy on a whim to help solve specific problems, like slow dataset refreshes or poorly performing reports.
- Migrate items between workspaces and tenants.
- Automate queries or tasks: Since you can schedule notebooks so easily, it means that any task that you can specify in the code of a notebook, you can automate. This could be anything from periodic queries of a data source or semantic model (for data quality checks, like regression testing) to snapshotting data (gasp!) like report usage metrics, to automating certain tasks with APIs or MCP. Here’s some examples of what you can do with this:\
- Automated regression testing of volatile data sources.
- Automated testing of Power BI semantic models, like testing for referential integrity violations.
- Automatically collecting semantic model statistics and saving them in OneLake to monitor memory footprint growth over time.
- Retrieve and transform some data more efficiently: Power Query is an amazing tool in Power BI that lets you do a lot when it comes to data transformations. It’s accessible and scalable in many ways. However, it isn’t suitable for all scenarios, data sources, or data sizes/scale. At a certain point, you might need to look for alternatives once you experience slow refreshes and timeouts. Notebooks can be a great way to do this, particularly with the Power Query-like user interface of Data Wrangler, which lets you make data transformations and converts that into Python code (like how Power Query converts transformations to Mash-up). Notebooks are also thought to be quite resource-efficient in Fabric (depending on your code, of course). Just be aware that if you start using notebooks to transform data, this is a step up in architectural complexity from doing all your transformations in the semantic model via Power Query. You will need to think in layers; dropping data in a Lakehouse, managing Delta tables, scheduling notebook runs and so forth. However, if you can grow into this complexity naturally (and incrementally), then there’s a lot of value to be had, here. (You also don’t need to use Direct Lake… you can keep using Import on the Lakehouse SQL endpoint just fine…)
So a notebook is like an external tool, right?
Kind of… but also, no 😊. A notebook is something else, entirely. Notebooks are distinct, general-purpose artifacts in Fabric… not just tools to support Power BI. Their scope, purview, and purpose go well beyond that of external tools:
- External tools are typically born to solve a specific problem, and a lot of external tools work only with the Power BI semantic model (although a handful of tools for reports exist). External tools are specialized and focused on helping you with a particular task.
- Notebooks are interactive environments for you to write your own code to accomplish any task that you can articulate with that code. Notebooks are general-purpose tools for doing a wide range of tasks, but easily let you scale those tasks across multiple items and workspaces.
To use a metaphor, external tools might be like new tools in your belt – power tools that you whip out in specific scenarios. Drills for holes, saws for cutting, a nail gun for nails. A notebook, meanwhile, is like having access to an entire workshop. You can build anything from scratch, presuming that you have the available raw materials (Fabric capacity), expertise (knowledge of code and concepts), and design. Note that even in the workshop, you’ll still be using lots of different tools to do different tasks, and complete those tasks better or more efficiently.
Do I need to use a notebook?
If you’re overwhelmed with all the new things coming out in Fabric (and in general nowadays), that is totally normal. You don’t need to use notebooks, write code, or anything like that. Just be aware of what a notebook is and why/when you might use it. That’s all!
We just think it is important for you to be aware of the scenarios where a notebook can be helpful for you, such as:
- You need to repeat a task across many instances, like changing formatting in many visuals of a report, changing the same DAX expression in many models, and so forth.
- You want to use the Power BI or Fabric APIs to facilitate administration or monitoring tasks.
- Etc.
Where can you go to learn more?
If you want a practical introduction to notebooks, Semantic Link, and Semantic Link Labs, we cover that in new “practical introduction” course. You can find the course at learn.tabulareditor.com. Like all of our articles and trainings, course is free for everyone; no license or cost required. We know how hard it can be to learn and do what you need when working with Power BI – and we hope that we can help.
For further reading
- TMDL scripts, notebooks, and Tabular Editor: tools that help you scale (Tabular Editor). A deeper comparison of when to use notebooks versus TMDL scripts and C# macros, building on the notebook introduction here.
- What is a semantic model in Power BI: Simple guide (Tabular Editor). A beginner-friendly explanation of the semantic model artifact that Semantic Link and notebooks are primarily designed to interact with.
- Semantic link overview (Microsoft Learn). The official documentation for the Semantic Link library, the core Power BI integration layer for Fabric notebooks introduced in this article.
- Semantic Link Labs GitHub repository (GitHub). The open-source repository for Semantic Link Labs, the expansion library whose convenience functions are highlighted throughout this article.
In conclusion
Notebooks are a big deal. We love them; we use them all the time. They let you do a lot of cool, new things in Power BI. Chances are that unless you are an engineer or a (data) scientist, you haven’t heard of or used notebooks before.
However, don’t be intimidated; notebooks can be a big benefit for you to be able to improve productivity. They aren’t a development tool like Power BI Desktop or Tabular Editor, but an additional tool that enables you to do more among a wide variety of tasks.
Pair Fabric notebooks with Tabular Editor 3 model work.
Give Tabular Editor a spin