
Key takeaways
- A semantic model is your reusable foundation: It turns source data into tables, relationships, measures, and security rules that reports and AI rely on.
- Start with requirements and data: Begin with what the model must support and whether your data is ready, then shape relationships, dates, and DAX around that.
- Use AI as a helper, not a replacement: AI can organize requirements and test your thinking, but it shouldn't replace deciding what the business actually needs.
- Pick the right tool for each step: Use Power Query, Power BI Desktop, Tabular Editor, DAX queries, and deployment pipelines where they fit the workflow.
This summary is produced by the author, and not by AI.
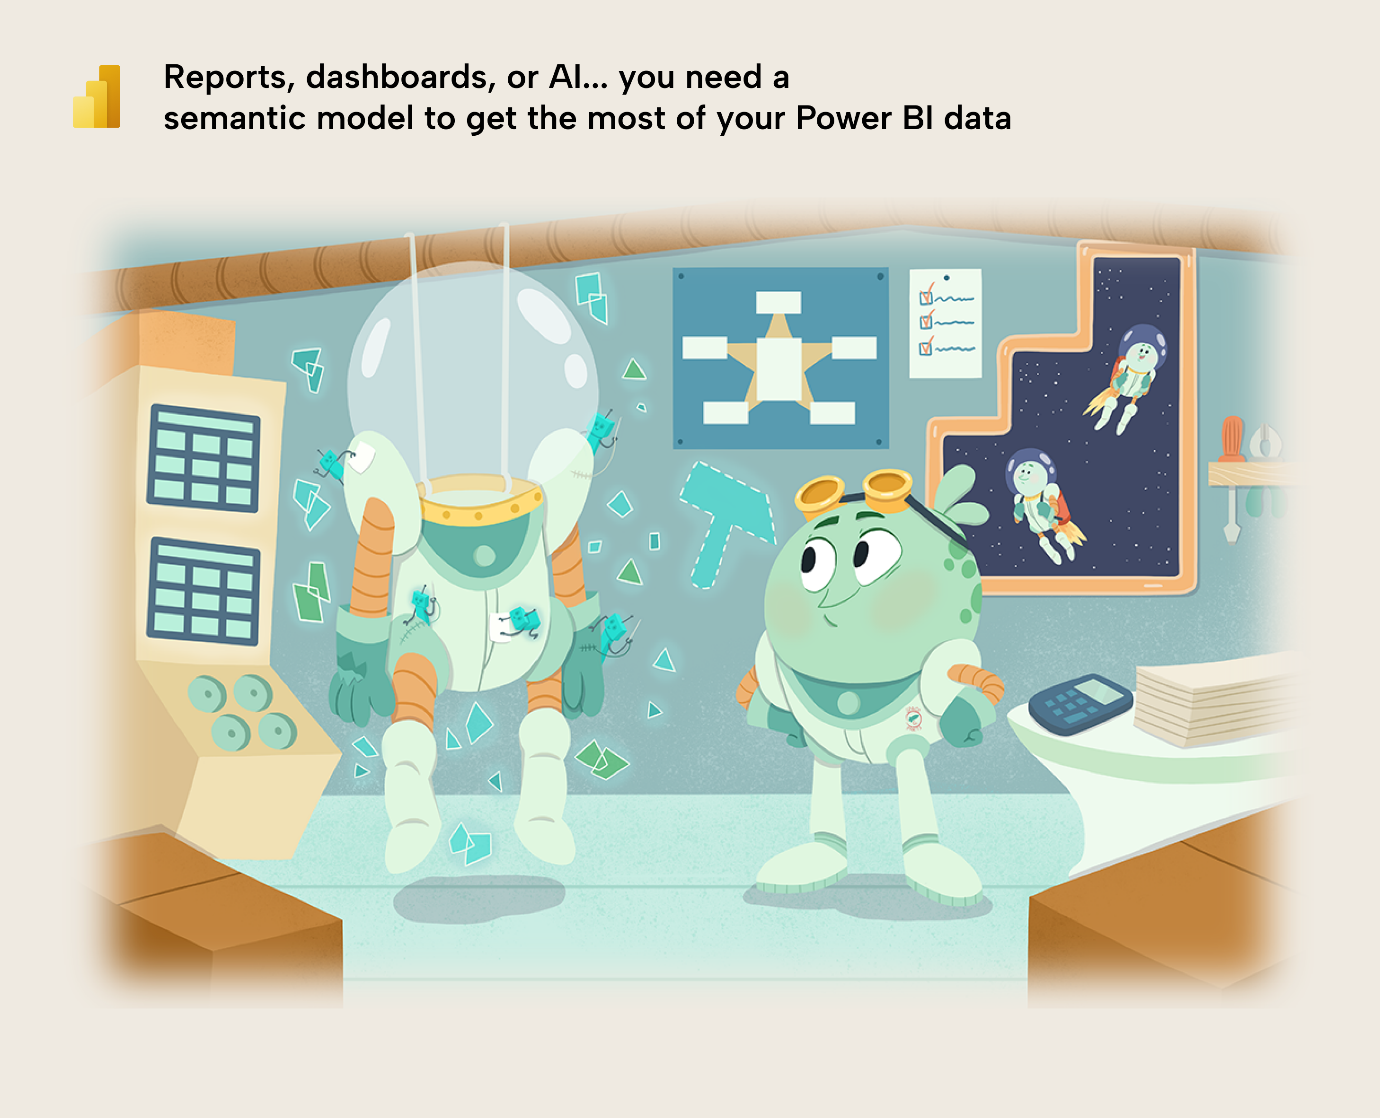
If you want a Power BI report – a dashboard – or want to ask questions about your data by using Copilot or another data agent, then you need a Power BI semantic model. It sounds technical, but really, it’s just the data and calculations sitting behind your report. In a nutshell, a semantic model is the engine and the brain for analytics and AI; it’s just the setup of your data to reflect whatever business process you’re reporting on or analyzing.
Creating a semantic model can be quite intimidating, if it’s your first time. In this article, we want to walk you through the basic, most important steps, so you can get up and running quickly. This isn’t a comprehensive tutorial, but just a quick starting point and reference guide for each step, if you’re new to Power BI.
NOTE
AI can help with parts of this workflow: Tabular Editor 3 has an AI Assistant, the Tabular Editor CLI can be driven by coding agents, and TMDL files can be edited directly in VS Code. None of that replaces the fundamentals in this article. Use the tools to speed up careful work, not to skip understanding the model you are building.
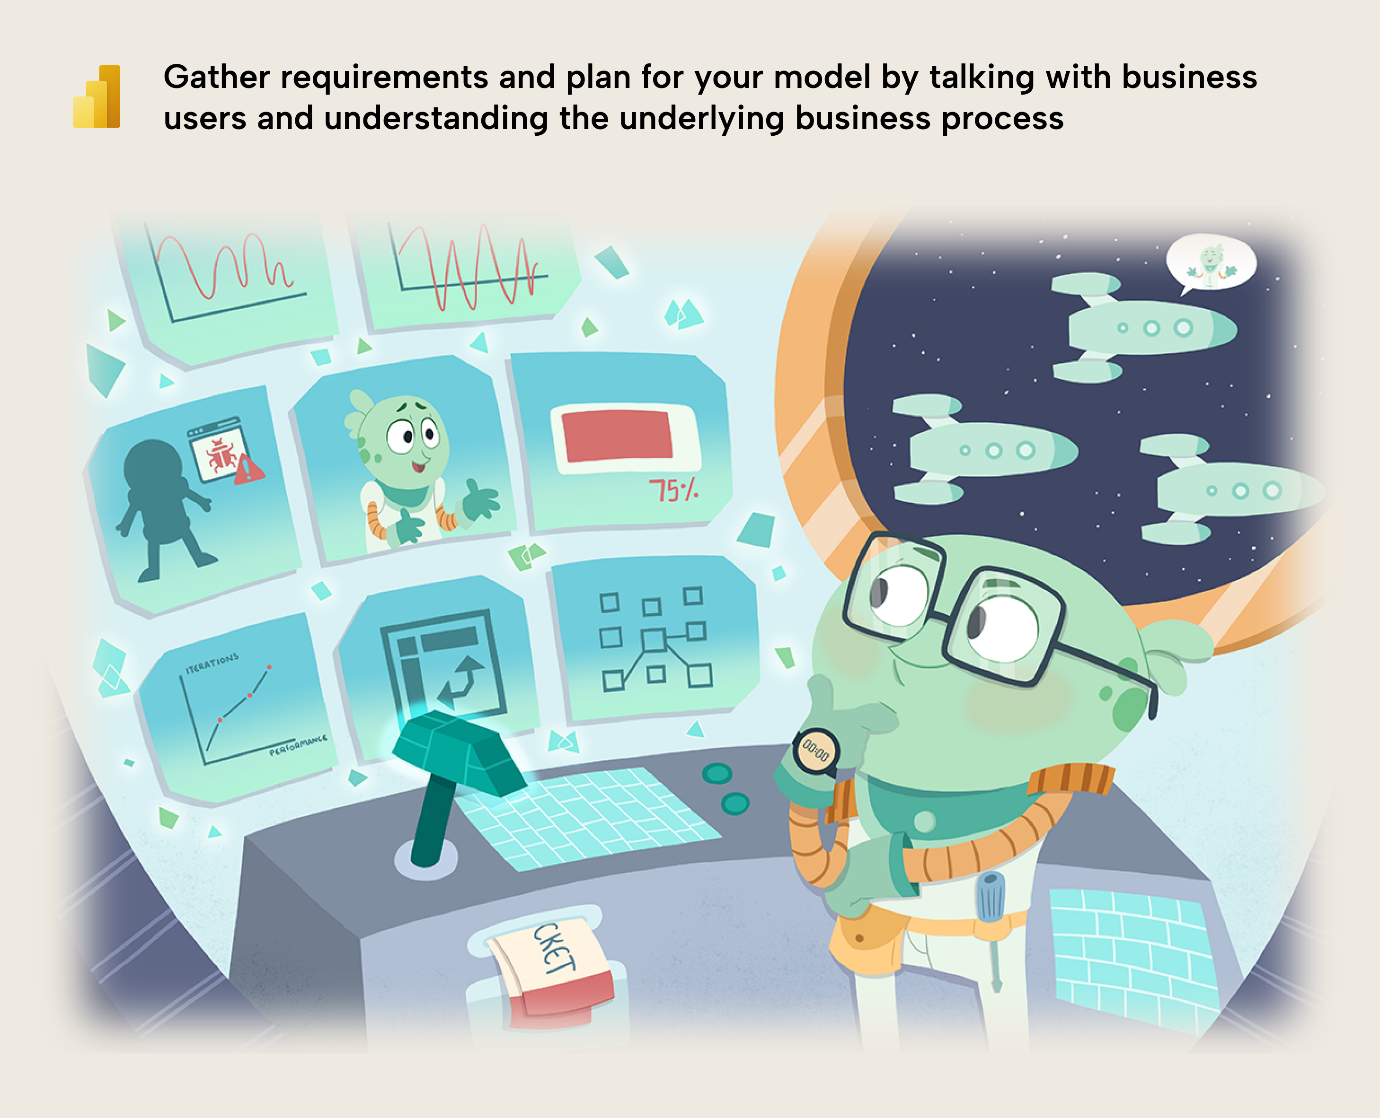
Step 1: Requirements ➔ What are you making?
You first need a clear understanding of what you are making, who will use it, and why. If you don’t, then you run the risk of making something that isn’t useful, which wastes resources. To avoid this, you should form a good plan and create a good design to make something that will be useful. This is critical irrespective of whether you will build yourself, or with AI assistance.
This first step is all about requirements gathering and design. If you’ve never done this before, then you can already go very far in a few steps:
- First, find out who will use the reports, agents, or model that you’ll make.
- Next, go talk with them. Ask them about what they need, what they’ll do with the data, and why. Look at the data together, and try to understand the underlying business process, the problems or questions they need addressed, and how this all relates to the data.
- Then, you can look at some examples of existing worksheets, reports, and dashboards that these people use, today. This can really help to give you an idea of what is needed and why.
- If you will make a report, it helps if you sketch out a plan by creating wireframes or mock-ups. This can be as simple as pencil-and-paper, or something more complex with design tools like Figma. The tools are not important; what is important is that you now have a clear idea about what you want to make and why. This doesn’t need to be super detailed.
WARNING
This step is the most human part of the whole process, do not outsource it to AI. Requirements gathering is empathetic and interpersonal work: you have to interview your stakeholders, watch how they actually use their current reports, and dig for the questions behind the questions.
Resist the temptation to drop a requirements document into your chatbot of choice and let it spit out a model design. The output may look convincing, but if the requirements were never truly captured, you’ll have built a dashboard that gets dropped like a rock the moment it’s delivered. AI can help you organize and sanity-check what you learn, but it can’t do the listening for you. For how to do this well, see We need this report in Power BI.
Helpful resources
If you want more details about requirements gathering, we have some helpful links for you, here, each of which have more detailed steps, approaches, or even frameworks and templates to do this first step.
- Gather requirements for a semantic model (Tabular Editor)
- BI solution planning (Microsoft)
- We need this report in Power BI (Data Goblins)
- Requirements gathering framework for Power BI reports (Ahmad Chamy)
Step 2: Data ➔ Is your data ready for reporting?
Garbage in, garbage out is an adage that remains true in the “era of AI”. In short, if your data has problems, then your models and reports will have problems. Therefore, before you start building anything, you need to explore your data and evaluate whether this is a possibility, or not.
This is quite simple: you need to spend some time browsing and evaluating your data to try and find any issues that could prevent you from doing a good job. It doesn’t matter if your data source is a single Excel file, or multiple enterprise data stores. Trust us, if you spend at least half a day doing this, it will save you a lot of time and headache down the line.
It doesn’t matter how you explore your data; you can do this in Power BI itself (either in Power Query before you load the data, or in the report canvas after you load it). This is also something that some AI tools can help with, if your organizations have access to ones that are safe to use for your security and privacy guidelines.
Here are a few things that you need to look for or think about:
- How will you connect to your data source? For a lot of people this is already a big hurdle. Some data sources require custom connectors, and some data sources just do not work very well with Power BI (for various reasons) and require another layer in the middle.
- Missing data in tables (missing rows) or columns (missing values). Make sure you check for both null (empty) values, as well as values like empty strings or spaces, which appear as white space.
- Unexpected values that don’t make sense, like letters in a numerical field, or values that are significantly larger or smaller than others.
- Duplicate rows or columns.
- Missing columns or tables that you need to make the model or report. Make sure you also check for columns that are differently named than you expect. Common examples are categorical fields for filtering or numerical fields needed for a particular calculation. This is partly why having a plan is so important: you then know these things up-front.
- Too many rows or too few. If you have too many, you might want to filter the data before you use it. If you have too few, there might be an issue in your source data.
At this point, you might want to transform your data. You can do this in Power BI by using Power Query, which is quite easy to use, and can be very powerful. However, if you are making a model from a Lakehouse that someone shared with you, then you might not be able to do this. If that is the case, then you will have to contact the person who owns the Lakehouse to request data changes or transformations.
In general, you should know that there are various tools that you can use to transform your data. In general, the guidelines are to use the right tool for the right problem, and transform data upstream if possible, and downstream if necessary:
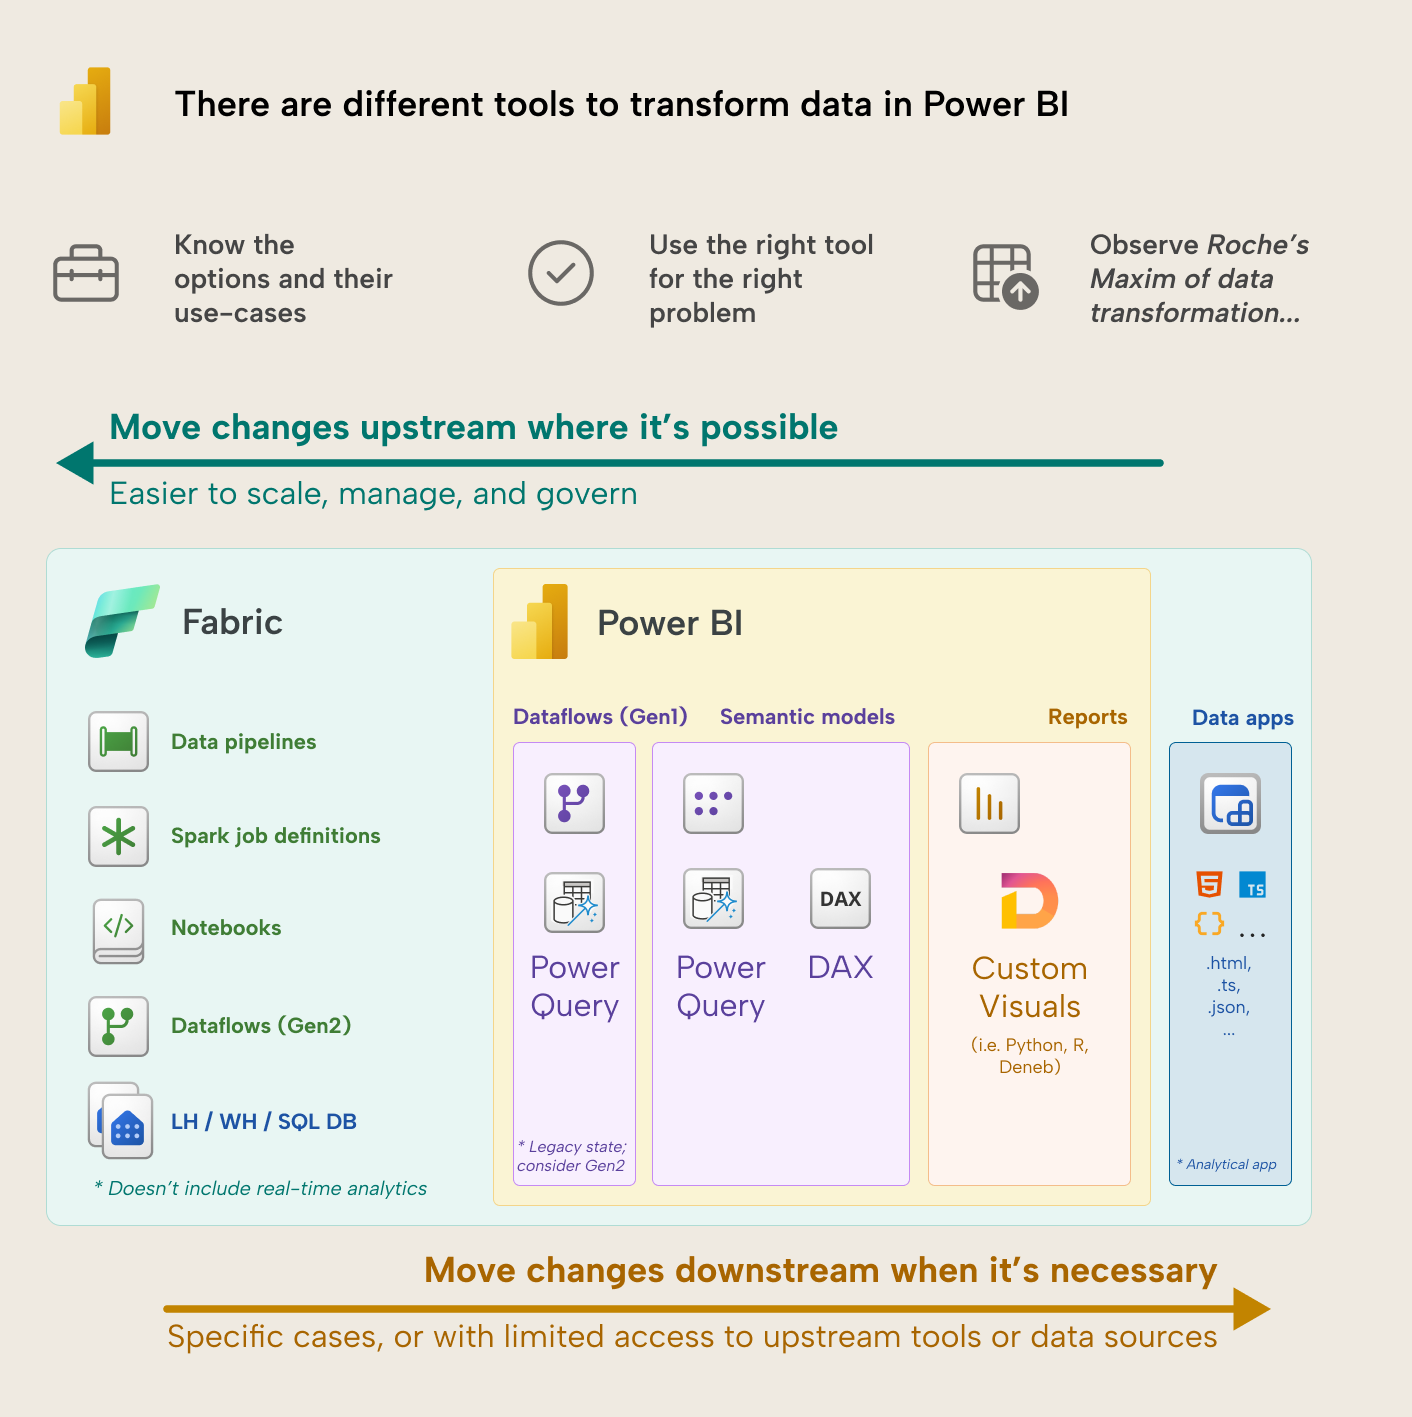
If you are transforming data in Power Query, though, it helps to follow some tips:
- Filter as much as you can; only keep what you need. This will help you keep your model performant and well-organized, and is recommended in every scenario. Apply this both to rows (by filtering) and columns (by deleting them or aggregating).
- Avoid “expensive” operations like joining (merging) tables or appending them together. Other examples include sorting tables and columns.
- Check that you are following the Power Query best practices from Microsoft.
AI can help here, too. In Fabric Dataflows Gen2, Copilot can explain what a query or step does in plain English and can turn a plain-language description into a custom column, so you learn what your transformations do instead of guessing. Tabular Editor’s AI Assistant can also profile your data for quality issues before they reach the model.
NOTE
Fabric Data Apps are a new alternative to Power BI reports. Getting your data ready for those is arguably simpler than getting your data ready for reports, and we’ll publish an article on that topic soon. Read our blog on data apps for what they are and how they compare to reports.
Helpful resources
Some helpful links for this step include:
- List of all Connectors in Power Query (Microsoft)
- Connect to and transform data for a semantic model (Tabular Editor).
- Prepare your data for a semantic model (Tabular Editor)
- Power Query best practices (Microsoft), which we also linked, above.
- powerquery.guide
- Profiling semantic model data in Tabular Editor (Tabular Editor)
- Copilot in Power Query (Microsoft)
Step 3: Relationships ➔ Do you have multiple tables?
If you have multiple tables, then you will have to figure out how to use them together. In other tools, you typically join the tables together or perform a LOOKUP to add column values from one table to another based on a common field. You can do these things in Power BI, but it is much easier to just link the tables with relationships.
Relationships let you group data from one table using columns from another table. You set up relationships when there are two columns with the same values on either table. Relationships are what enable Power BI to use multiple tables conveniently and efficiently without having to smash them together during data transformation.
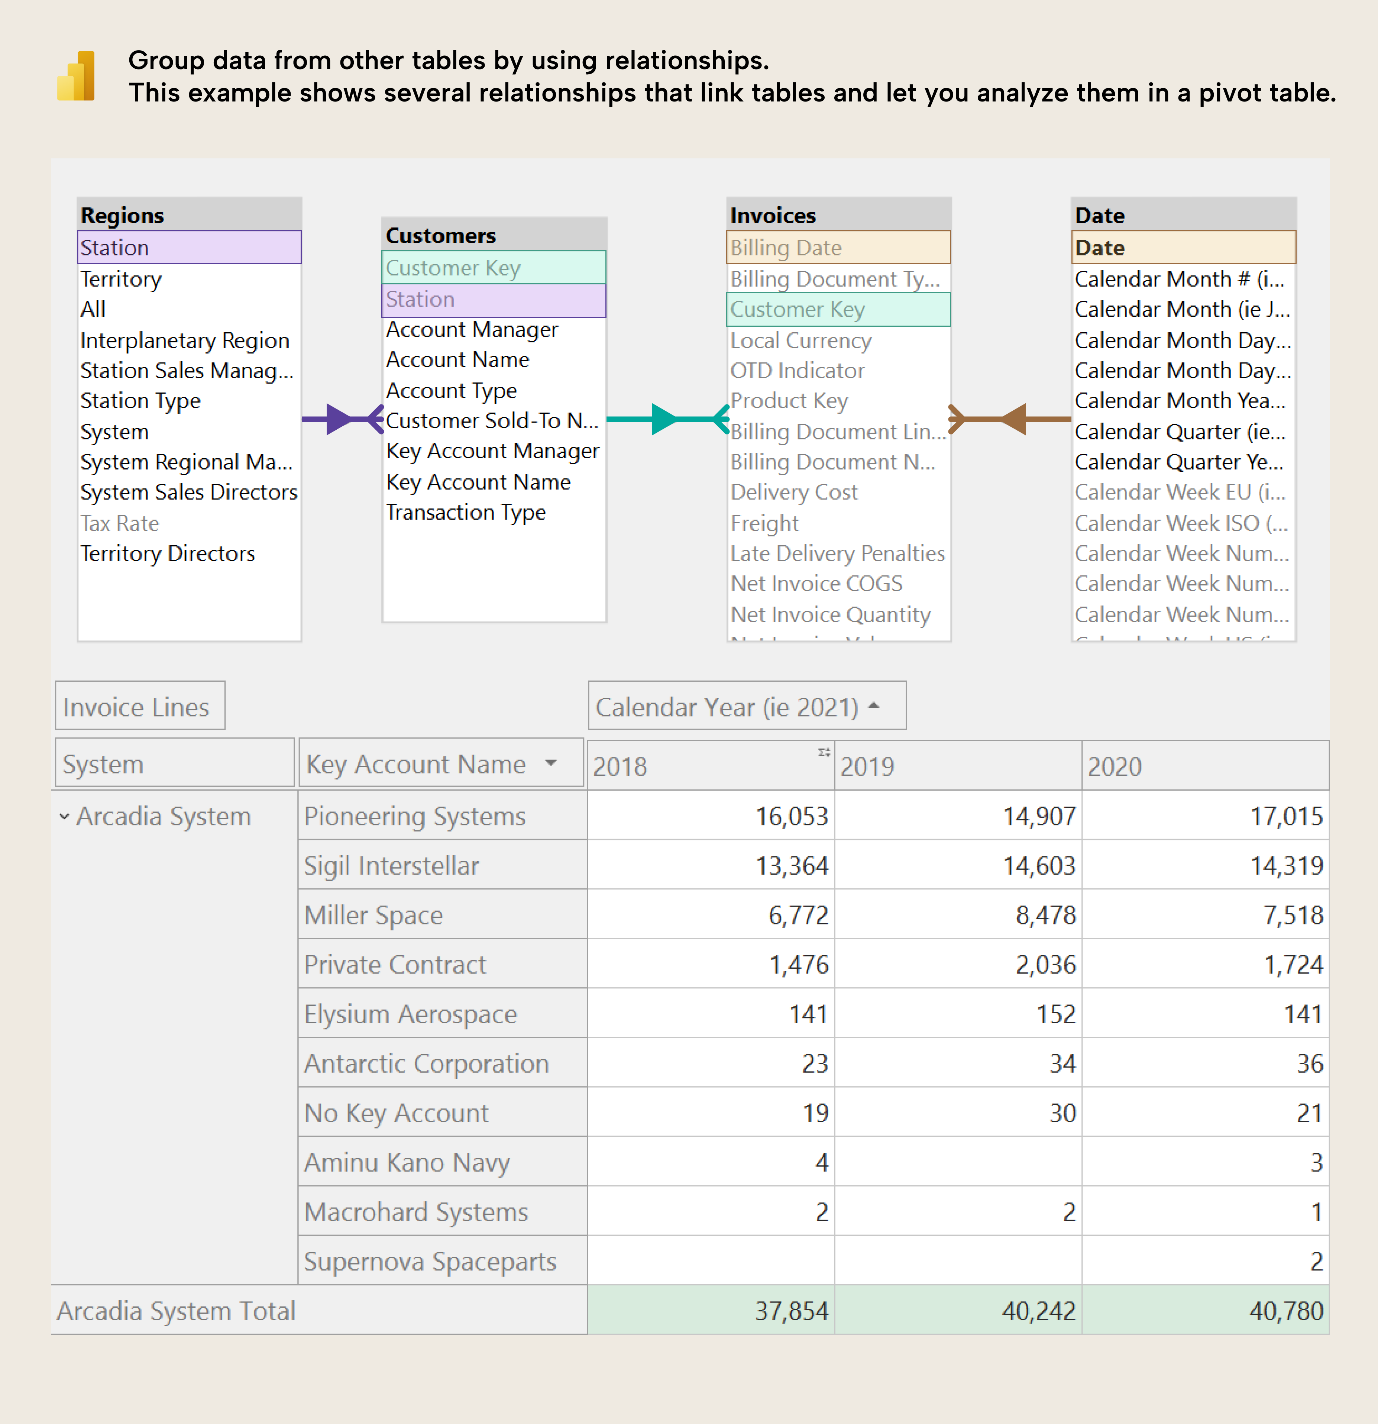
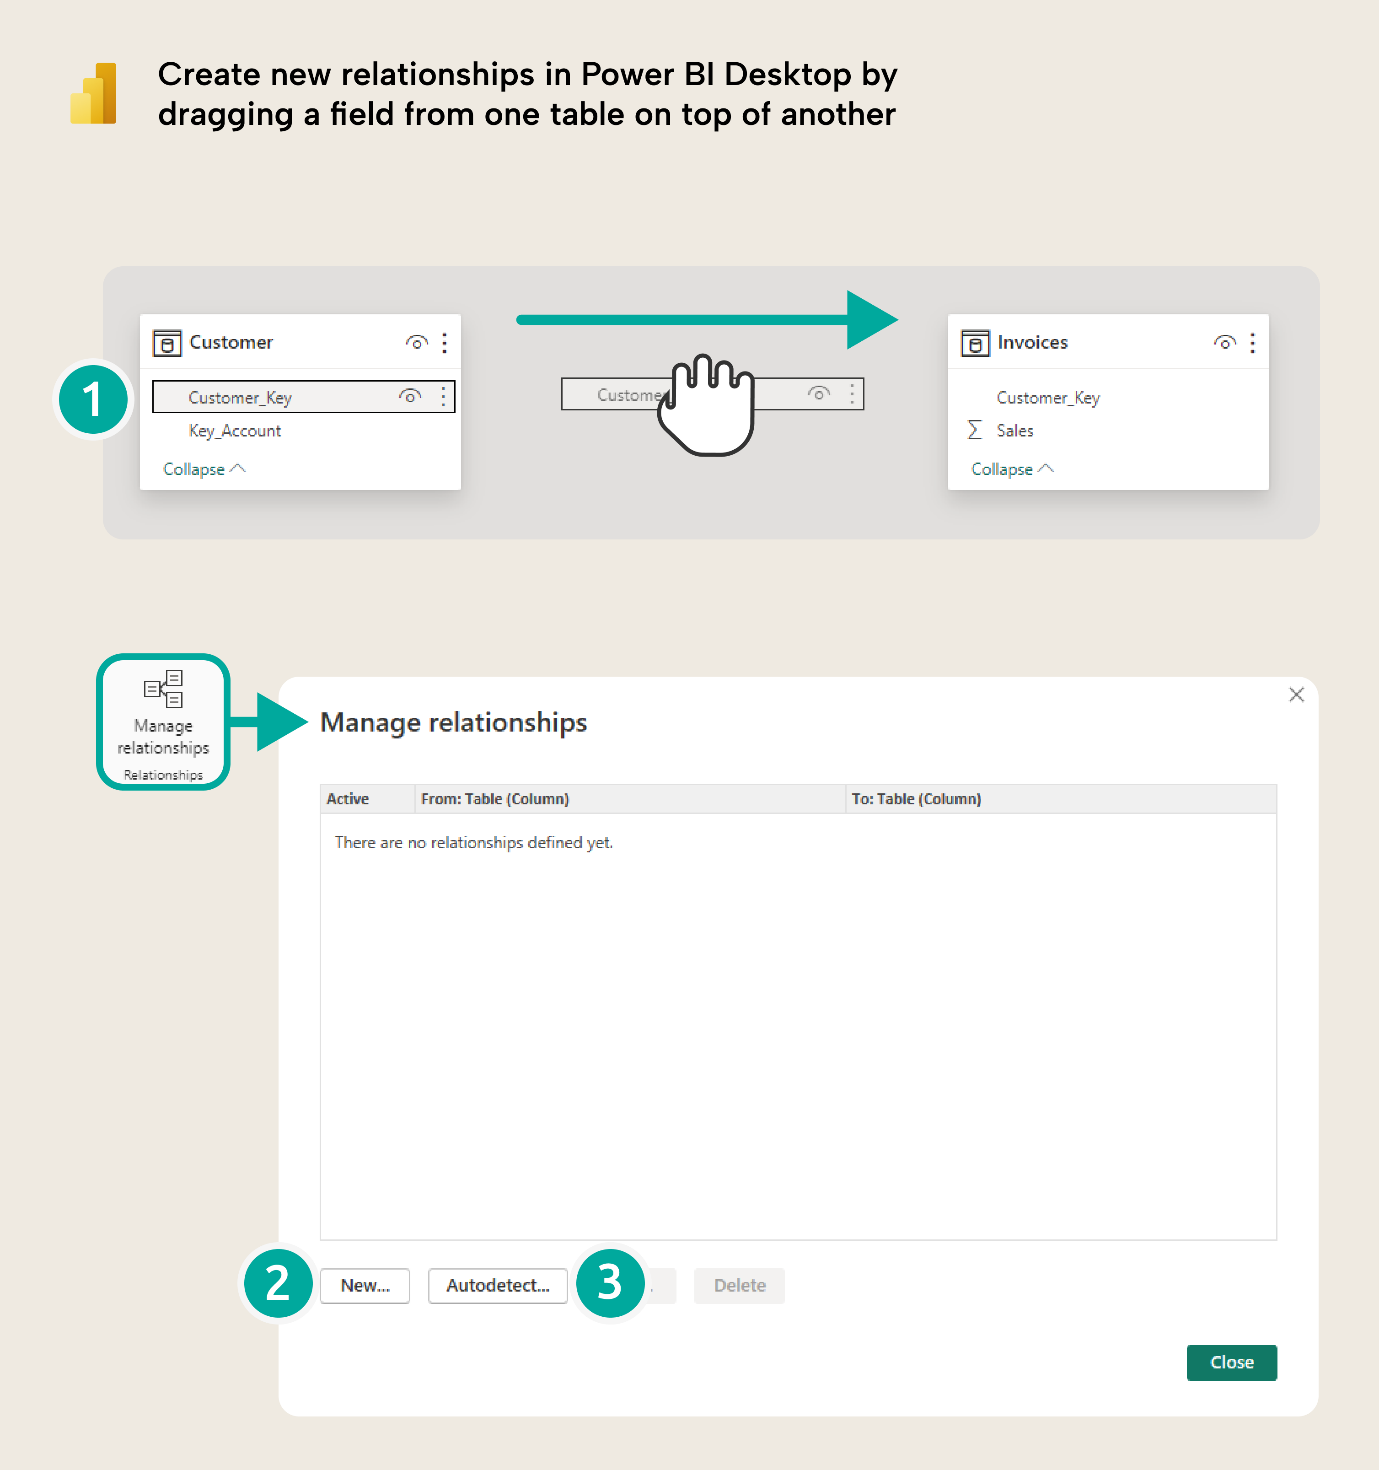
Power BI will automatically create relationships for you when you load tables for the first time (or when you refresh data, if you enable it in the settings). However, you will likely need to create or modify relationships, yourself, too. This is easy to do either from the model diagram view, or from the Manage relationships pane:
This is essentially the core of what data modelling is: choosing the tables and columns so that you can link them all together in way that is functional, makes sense, and gives you the result that you want. If you plan your tables and relationships well, then your model should somewhat resemble a star schema, where tables that have descriptive attributes (dimension tables, like product or customer) link tables that have quantitative attributes (fact tables, like sales or budget).
You don’t have to use a star schema model design. However, Power BI (and your reports and queries) typically performs best when you do. You can read more about the star schema below if you are interested or need more detailed help on the subject.
Helpful resources
Some helpful resources for this step include:
- Create semantic model relationships (Tabular Editor)
- Relationships guidance (Microsoft) – Be sure to check all the articles in the series
- What is a star schema? (Microsoft)
Step 4: Date table ➔ Do you have date fields in your data?
If you have dates in your data that you will use in a report or in queries, then you likely need a date dimension table. A date table is a special table that contains all the dates from the earliest possible date in your model, to the latest possible date (or possibly future dates). If you’ve never heard this before, it might seem strange. However, this is an important part of a data model for the following reasons:
- Date is a standard dimension, with standard varying date attributes like Month Name, Month Number, and so on. It makes sense to have a date table to group and organize these attributes in one place.
- This ensures that you can see dates even when there are no transactions (table rows) for the dates in your data.
- Ensure that your filters and calculations work as expected, including time intelligence measures to do things like calculate year-to-date or month-to-date, or the same period previous year (or month).
It doesn't matter how you create your date table, but most people prefer to do it in DAX. There are a variety of templates and tools that help you do this, so it isn't something that you should spend too much time and effort on. Just make sure that you are using a date table and that it is configured properly in your Power BI semantic model.
If your organization uses a nonstandard calendar (a fiscal year, retail 4-4-5 or ISO weeks), the new enhanced time intelligence lets you define that calendar on your date table and use calendar-aware functions like TOTALWTD and STARTOFWEEK, instead of hand-writing fiscal-week DAX.
Helpful resources
Some helpful links for this step include:
- Design guidance for date tables in Power BI Desktop (Microsoft)
- bravo.bi (SQLBI) – a tool that can easily add date tables and fields for you. We recommend this approach for beginners, but there are other templates, too:
- DAX date table template (SQLBI)
- DAX date table in TMDL (Zoe Douglas)
- DAX date table in Tabular Editor C# script (Tabular Editor)
- Power Query date table template (Matthew Roche)
- SQL date table template (Blue Granite)
- Calendar-based time intelligence (Microsoft)
Step 5: DAX ➔ What calculations do you need to use?
Chances are that you will need to aggregate data in your model to show a total sum, average, or something else. You can do this by selecting a column and grouping it in the visual, which is known as an implicit measure. However, implicit measures are unreliable and can cause problems in different ways.
Instead, you will probably need to use the Data Analysis eXpressions (DAX) language to specify your calculations in DAX measures. Measures are just calculations that you organize in tables and use in visuals to group data. If you are completely new to Power BI and do not have a technical background, then you will likely struggle the most with DAX. However, there are a lot of AI tools which can help you write DAX now; although, when you use AI to generate code, we do recommend the following:
- Get a good understanding of the foundational concepts. Things like filter context, row context, CALCULATE, variables, and that “filters are tables” in DAX are already solid.
- Instruct the AI tool to not give you the answer straight away. Instead, have it give you hints and demand that you explain the answer, first, before it gives you a result. This might seem inconvenient and frustrating, but in our experience, it is a great way to learn with AI.
- Invest time in trying to plan what you want the calculation to do and how you think it should work. Provide the AI useful resources like dax.guide or examples of similar calculations that you might do in other tools like Excel. You can even give it some sample data and explain what you expect the result to be. The better you plan, the better you prompt, and the better your result.
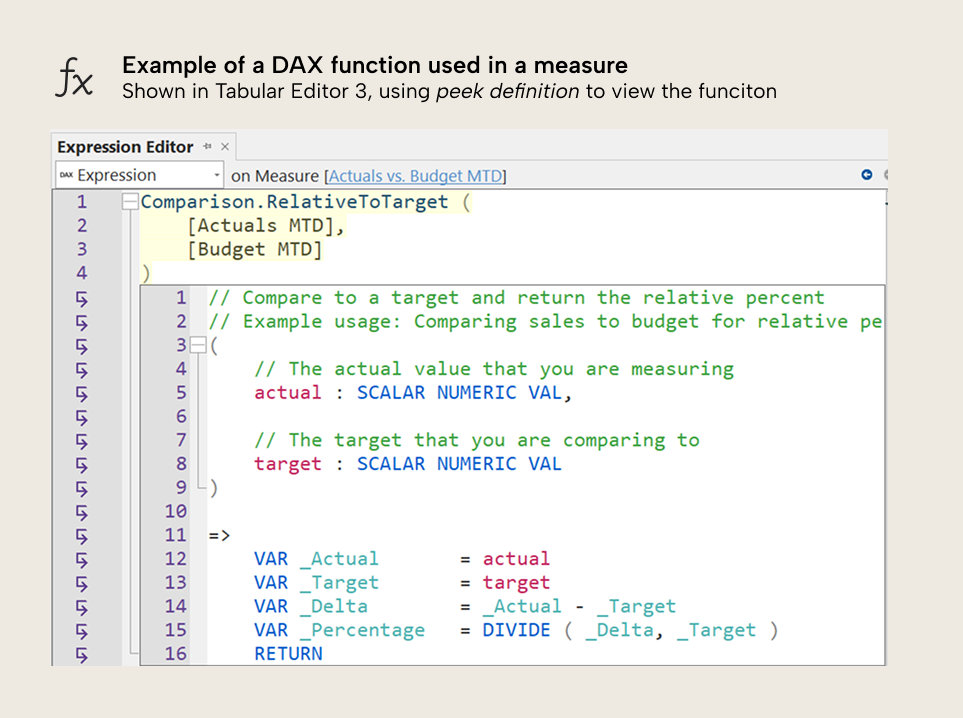
User-defined functions (UDFs) are useful when a calculation pattern should be reused. You define the logic once with parameters, then call the function from measures that pass in the relevant model values. You can read our blog on UDFs in simple terms to get started.
For example, a reusable comparison function can calculate the relative difference between an actual value and a target value:
Comparison.RelativeToTarget =
(
    actual : SCALAR NUMERIC VAL,
    target : SCALAR NUMERIC VAL
) =>
VAR _Actual = actual
VAR _Target = target
VAR _Delta = _Actual - _Target
VAR _Percentage = DIVIDE ( _Delta, _Target )
RETURN _Percentage
Actuals vs. Budget MTD =
Comparison.RelativeToTarget (
    [Actuals MTD],
    [Budget MTD]
)
The measure stays short, and the comparison logic lives in one place. This is easier to maintain than copying the same percentage-difference logic into multiple measures.
If you would rather not write functions from scratch, the DAX Package Manager installs ready-made, community-maintained ones from daxlib.org in a few clicks. For common report calculations like a running total or percent-of-total, visual calculations are often the easiest route and need no model measure at all. Copilot in the DAX query view can also generate and explain DAX, but you should still check its output.
Note that you might also have to set up specific tables, relationships, and DAX for data security, which is a separate and complex topic that goes beyond the scope of this article… but it might be something that you need to consider, even for a first model.
Helpful resources
Some helpful resources for this step include:
- SQLBI video courses about DAX (both free and paid)
- DAX basics in a semantic model (Tabular Editor)
- Write DAX for a semantic model (Tabular Editor)
- Visual calculations (SQLBI) – Visual calculations can be an easier way to write and use DAX for many authors and creators, so if you are new to Power BI it is worth mentioning.
- DAX user-defined functions (UDFs) for Power BI in simple terms (Tabular Editor)
- 8 tips for writing user-defined functions in DAX (Tabular Editor)
- Introducing the DAX Package Manager (Tabular Editor)
Step 6: Test it ➔ Does it work?
It might seem obvious, but you need to test your model thoroughly as you build it before you start to create your reports, agents, or share it with others. This requires a good, critical, and inquisitive mindset. Honestly, one of the best ways to do this is to just throw a bunch of visuals on the report canvas, and filter everything a variety of different ways. Then, look to see if there are any unexpected results, blanks, or other issues.
Once you identify and fix the biggest problems, then you can continue testing as you build reports. If you are only building AI agents or plan to share your model directly with others, then you might want to extend and deepen your visual-based testing, instead. Regardless, you need to really think like a business user as you test; see the data from their point of view.
Some things to look out for as you test include:
- (Blank) values, which indicate missing or empty values in one side of the relationship.
- Slow calculations or incorrect figures, which indicate flawed DAX code or model design that must be optimized.
- Filters that do not work, which indicate missing relationships.
- Filters that return strange results that are typically too small, or “over-filtered”, which indicates flaws in your relationship configuration or model design.
- General data quality issues that can’t be explained by your DAX or model, but by problems with the underlying data. This is important to identify as early as possible; ideally, in step 2.
TIP
You don’t have to check everything by hand. Tabular Editor’s Best Practice Analyzer scans your model against a community-maintained rule set and flags issues like missing relationships, risky DAX, or naming problems, which is a fast way to sanity-check a first model. You can also add your organization’s custom rules to, for example enforce a specific naming convention.
Helpful resources
Some helpful resources for this step include:
- Power BI Migration Guidance: Testing (Microsoft)
- Content lifecycle management: Validate content (Microsoft)
- Validate semantic model relationships (Tabular Editor)
- Happy together paths to test semantic models in Microsoft Fabric feature workspaces with BPA (Kevin Chant)
- Importance of shifting left when testing Microsoft Fabric deployments (Kevin Chant)
- Making your Power BI Teams more Analytic (Jon Kerski)
- Best Practice Analyzer (BPA) rules for semantic models (Tabular Editor)
Step 7: Distribute it ➔ How will you share and use it?
Once you create a model, you probably need to publish and share it (or the reports or agents that use it). Publishing and sharing a model seems like something so simple (just two buttons, right?). However, it is actually one of the more complex parts of creating a model, because there are so many possible options which determine who you can share with and what they can do with it.
The following is an overview of the options from the Microsoft documentation:
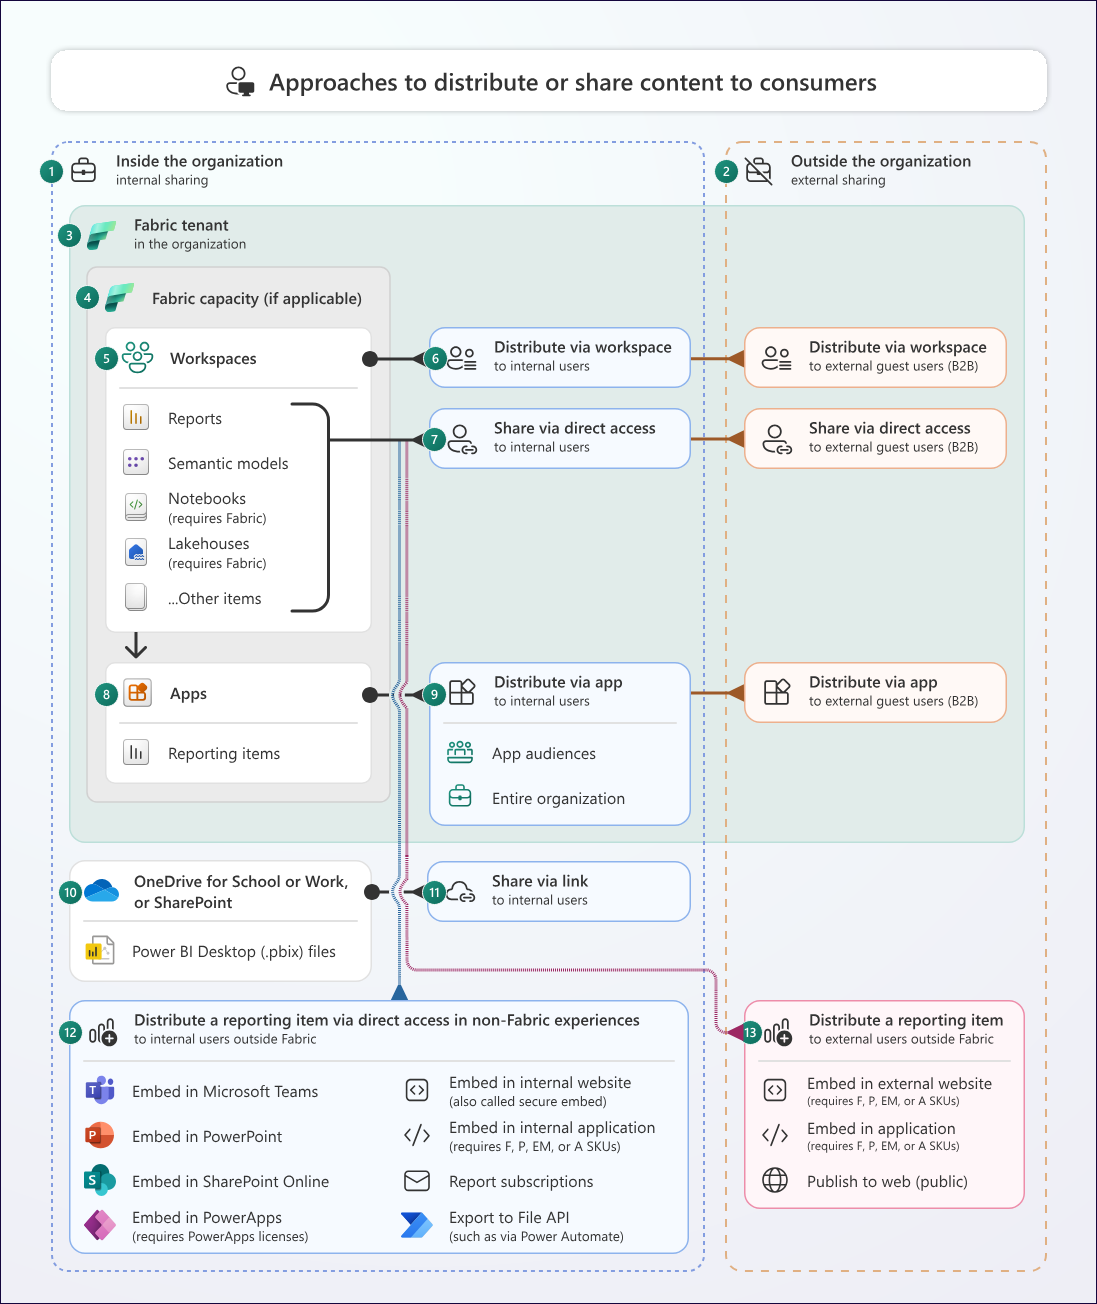
Diagram taken from Microsoft documentation: Content Distribution and Sharing.
In general, you want to ensure that you publish your model to a Fabric or Power BI workspace, rather than sharing .pbix files with other people. Then, you can connect to that shared semantic model from other items and re-use it.
To distribute a finished report set, the recommended approach is an org app: you bundle reports into an app and use audiences to show different content to different groups, and granting someone access to the app automatically grants them read access to the underlying semantic models.
Helpful resources
Some helpful resources for this step include:
- Content distribution and sharing (Microsoft)
- Content lifecycle management: Deploy content (Microsoft)
- Power BI usage scenarios overview (Microsoft)
- Articles about workspace roles, item permissions, apps and app audiences, and distribution to external guest users by Microsoft.
- Workspace planning (Microsoft), which is important because how you plan your workspaces determines how you will publish and share models.
- Org apps with audiences (Microsoft)
For further reading
- What is a semantic model in Power BI: Simple guide (Tabular Editor). A plain-language explanation of what a semantic model is, useful grounding before or alongside the step-by-step process in this article.
- Power BI semantic model checklist (Tabular Editor). A C# script-driven checklist covering the quality and handover criteria for a model built through the steps described here.
- Understand star schema and the importance for Power BI (Microsoft). The official explanation of the star schema design that Steps 3 and 4 of this guide steer you toward for better performance.
- SQLBI training (SQLBI). A curated library of DAX and data modelling courses from SQLBI, providing structured depth on the calculation and design concepts introduced here.
In conclusion
Creating a semantic model is complex. There’s a lot of steps, and we’re just covering some of the most important ones, here. If you want to learn more, please check out our other blog articles, and our free video trainings that can help you get started.
Build your first Power BI semantic model with Tabular Editor 3.
Give Tabular Editor a spin

