Key takeaways
- Align your model with how it's used: Reports, self-service BI, and conversational BI need different activities and investments to succeed.
- It's not one versus the other: You don't have to choose reports OR conversational BI, and neither is simply "better."
- Use criteria to decide: This article gives criteria for when reports or conversational BI bring more value.
- It depends on your context: The right choice depends on your users, your data, and your business process.
This summary is produced by the author, and not by AI.
In a previous article, we explained that you want to align the design, development, and support of your semantic model with how it will be used. Reports, self-service BI, and conversational BI can require different activities and investments to ensure successful implementation and adoption. In this article, we outline some criteria that can help you choose between using reports or using conversational BI with Copilot or other tools.
To clarify, you don’t necessarily need to choose reports OR conversational BI. This isn't about one approach being “better” than another. Rather, it’s more important to understand when and why these different analytics mediums can bring value for your users, your data, and your business process.
When to use reports?
The primary purpose of a report is to provide a focused, guided overview of data for a particular business process, with the possibility to interactively explore it for deeper insights. Reports can be created by individuals with specialized domain or technical knowledge and distributed for others to view and use. When well-designed and implemented in the right scenarios, reports can help centralize an organization’s view and use of their data with a consistent experience.
You want guided visual experiences that are time-efficient
When they are well-designed, reports treat attention like a resource. A user can arrive at a report and have their attention steered by big numbers and formatting, pre-attentive attributes, that can quickly help them get an overview and see where they should look deeper. The selection of chart types and their layout on and across report pages can also direct this attention to create a guided visual narrative.
Consider the following report example, which focuses on analyzing on-time delivery for a manufacturing company:
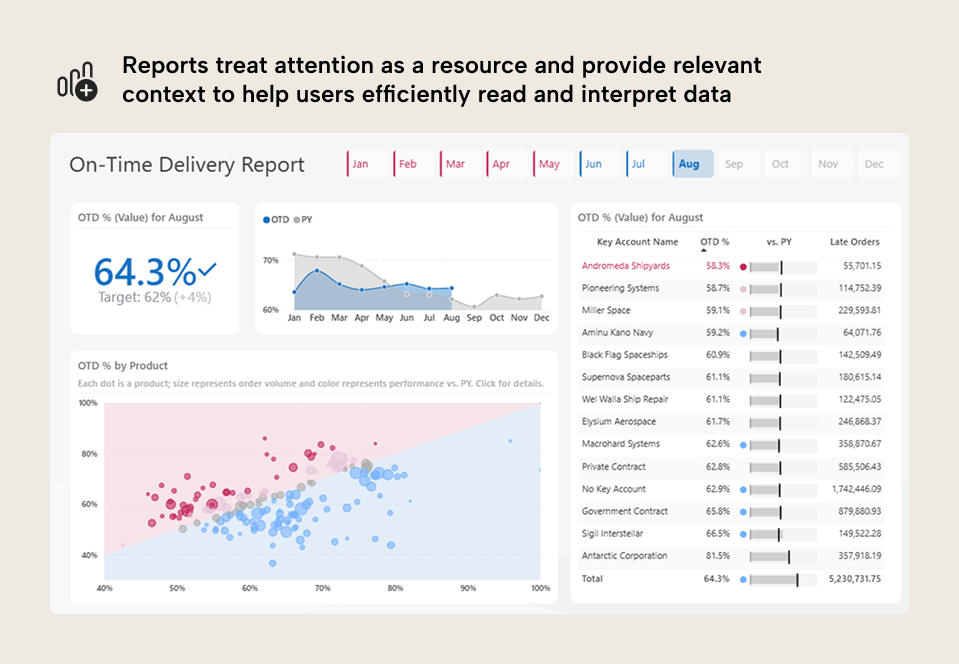
In this example*, users can quickly see:
- What the on-time delivery is.
- Visual context that communicates the on-time delivery is below target and worsening.
- Formatting cues which draw attention to the most problematic customers and products.
- Relevant details to further investigate, diagnose, or act upon the problem, like late orders broken down by the customer hierarchy.
*Please note that this is a hypothetical example and not a demonstration of good design. Design effectiveness can only be defined as a function of users, for which here there are none, since it’s just an example for this article.
As demonstrated, reports can provide an efficient and comprehensive view of the data, particularly for common or critical business questions. As such, if you already know the questions or problems that users will ask, then you will likely help users address them more efficiently with a report than if they have to ask a chatbot.
In contrast, conversational BI is a blank canvas where users must make a question or request to get the information they seek. This information is also provided piecemeal, divorced from other necessary or relevant data context they need to interpret the results. It requires extra effort for users to write a prompt, and also to write the “correct” prompt to get the “correct” answer. Furthermore, users have to construct the narrative themselves. This might not seem like a problem, but it means that you’re relying on the implicit understanding and data literacy a user has for a data process… it’s asking quite a lot.
Consider the following example of an interaction with Copilot:
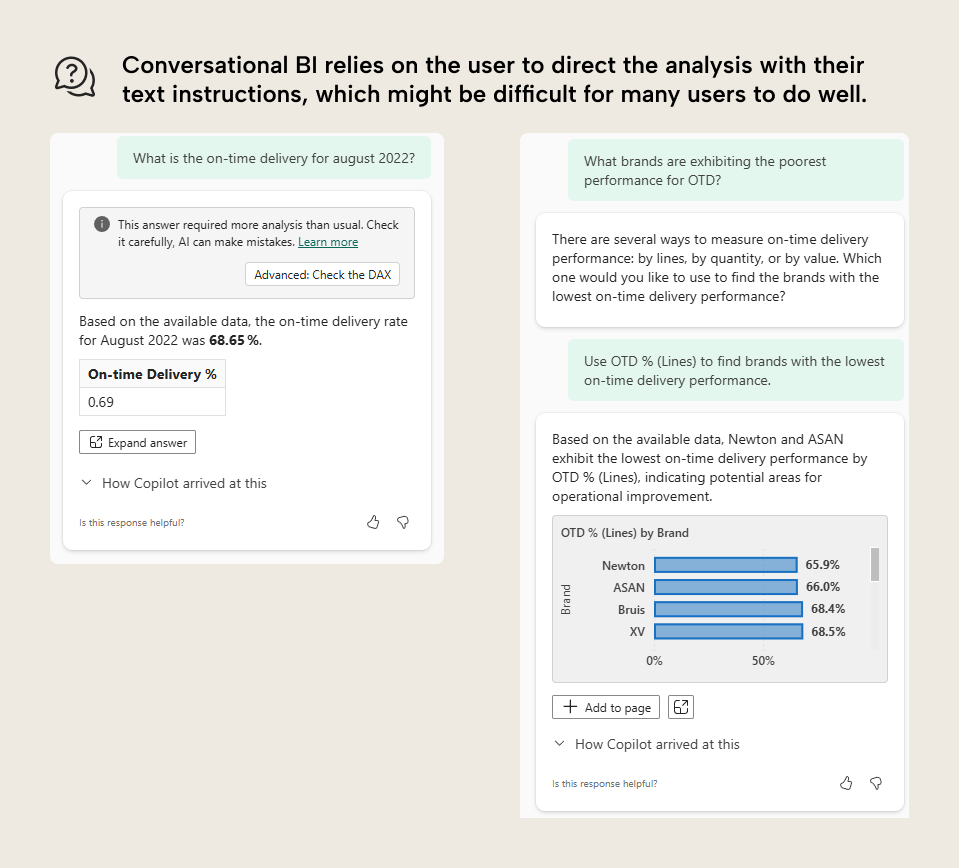
A user asks Copilot for the on-time delivery this month. Copilot returns a different result, because the report has applied specific report- and page-level filters that the user doesn’t know to include in their prompt. Copilot also doesn’t return a comparison to the previous year, since the user didn’t explicitly ask for it. These things aren’t a failing of Copilot. Rather, they are a discrepancy in the user’s analysis compared to what is being centrally served from the report.
This might be fine if the user has a mature understanding of the on-time delivery process and data. However, if they don’t, they may struggle to arrive at an actionable or useful analysis. Furthermore, they might also end up analyzing the data differently than others in their organization, leading to inconsistent results or conclusions.
You want consistency in what to show and how to show it
When you distribute a report, you know with certainty what anyone who views it will see, even when considering data security or user interactivity. This ensures that you can craft a consistent user experience for everyone, and control both what is shown and how you show it. In a report, every element on the page should be placed with a specific intent.
You can also scale this across different pages and reports. When you adhere to an organizational theme and style guide, you ensure that users will have a common experience when viewing different reports, even when they connect to different models. Reports are therefore very useful for centralized distribution, and can help your organization obtain a common understanding of their business through their data.
In contrast, conversational BI is inconsistent by design. It’s nondeterministic and relies on wildcard user inputs to return and response. As such, you can never fully control the experience for even small audiences. One user can have a wildly different experience, and thus get different answers, than another, depending on a number of factors.
For instance, when asking for On-time Delivery for this month, one user might get the On-Time Delivery in value while another might get it in percent. Even then, many organizations have different ways to calculate the same metric for different analyses. A user might get the OTD calculated by lines, quantity, or value.
In a report, you have explicit control over this, so you can use techniques like field parameters and measure selection to add flexibility but enforce a set default view.
It’s important to acknowledge that consistency is often an ideal and not commonplace in many organizations, unless they’ve reached a fairly high level of maturity.
Familiarity
While interactive reports might still seem new to many, business reporting in general has been around a long time. Most business users are both familiar and comfortable with looking at data in reports… or at least in Excel spreadsheets.
In contrast, conversational BI is a new technology that’s continuing to evolve. It’s immature, and most developers and users simply just don’t have enough real-world experience to use it effectively. Expectations for the technology have also been set sky-high by vendors (which, let’s be real, is their own damn fault) leading to frequent user confusion, disappointment, or frustration. The consequence here is that much more investment must be made to research and test the tools while also training users.
Change in business takes a lot of time and effort to implement successfully. Neglecting this can lead to a lot of issues, or even resistance to the change. This reason alone might be sufficient for you to opt for reports over conversational BI… if you don’t have the required time or resources to support the change… then don’t do it.
When NOT to use a report, in general
A Power BI report isn’t always the right answer, AI notwithstanding. There are cases when you might want to avoid making an interactive Power BI report, altogether. None of these scenarios are new, but we list them here anyway, since it’s useful to know and understand. Here are some examples:
- Multipage, tabular reports: Power BI reports don’t generally need separate pages to show the same visuals, since users can adjust the data with filters, slicers, and other interactions. However, when users have a preference or need for multipage reports, you might instead defer to paginated reports.
- Export scenarios: In reality, many request for exported reports come down to preference, where users want reports in their inbox or a SharePoint for convenience or re-use. However, there are valid scenarios where these exports are necessary to support certain business processes. The former scenarios might require additional user training or governance but can be addressed with report subscriptions. However, the latter scenarios are better addressed with paginated reports, instead.\
- Freeform data exploration: In Power BI, you can create exploratory reports that facilitate a question-and-answer exploration of the data. However, there’s a limitation to the flexibility that this provides. At a certain threshold, the flexibility results in a complexity or performance tax that might be beyond what you are willing to pay. Often, alternative approaches can be more flexible. They might also be required, such as when users have specific niche needs for calculations and data.\
- Advanced functionality: While there is a lot that you can do with reports, they are still limited in their capabilities. You might need custom visuals, interactivity, or other functionalities that aren’t feasible in a Power BI report. Examples might include animated “scrollytelling” experiences for data storytelling, or writeback in publicly available or embedded reports.
In some scenarios, particularly ad hoc data exploration, you might consider using conversational BI either instead of or in addition to a report.
When to use conversational BI?
Conversational BI allows users to engage with data by asking questions in natural language, which are translated to queries by AI. In theory, this could lower the technical barriers and effort required for users to perform their own analysis. It opens new possibilities to think through problems with data collaboratively with AI models. However, it also produces new challenges… many of which we’re only just starting to understand, and are certainly still far away from adequately addressing.
Ad hoc exploration of data
Currently, the strongest use-case for conversational BI involves data exploration. A question-and-answer experience can be a natural and simple way for non-technical users to engage with data. It doesn’t require that they learn new tools or user interfaces, since the chatbot experience requires no explicit information to understand.
This can be a very empowering for users to navigate data freeform, without the constraints of a pre-constructed experience or the technical obstacles that impede their analysis. In the Copilot standalone experience, users can even extend their analysis across multiple semantic models and other supported item types, if they wish.
For instance, a user investigating the On-Time Delivery numbers might want to enrich their analysis with data from another model. One example is the following, where a user pivots from an on-time delivery model to data about budget achievement for their region:
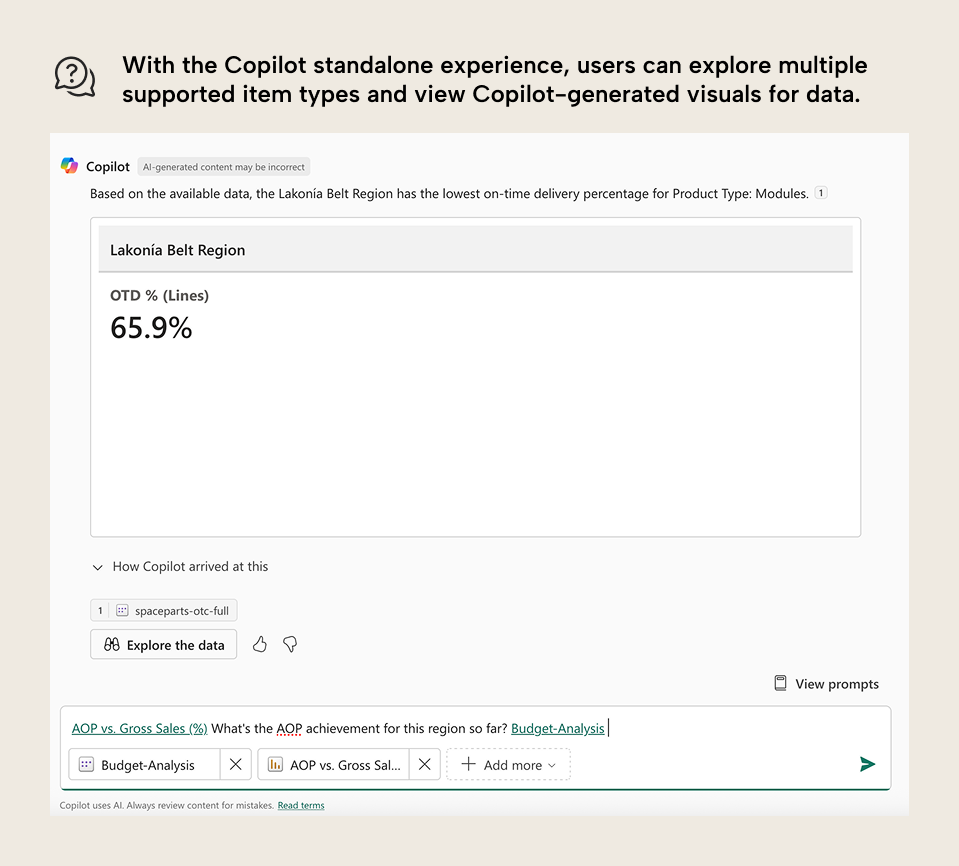
With Copilot, the user can ask to discover reports or data sources, or attach ones that they know have the information that they need. For a business user, no setup is required. From their point-of-view, they just have to ask their question and attach the appropriate item, with minimal user interface or technical elements that they need to learn.
Of course, the simplicity of this experience is also somewhat deceptive. Behind the natural language there are still complex elements that users might need to learn. This can include how to write prompts, validate results, or just understand the underlying technology, in general. Developers also still need to anticipate what data and fields users need and inform users about their availability. Of course, as we mentioned earlier and in previous articles, it also falls on semantic model developers to ensure that models are sufficiently well-organized, documented, and prepared for AI use to get any useful results.
In contrast, reports and other approaches require an explicit setup to facilitate exploration. This is somewhat mitigated with under-marketed features like personalize visuals, yet users still have to overcome technical barriers to explore the data. Often, they will encounter scenarios where they have a question but can’t translate that question to the correct series of actions that they need to take in an interface. This is compounded in self-service scenarios, where users might be asked to write limited DAX or undertake multiple technical steps to get the output that they want. This can be unreasonable to expect of a business user in many circumstances.
Open-ended or ambiguous problem spaces
Using natural language to engage with data opens many new possibilities. Among them is the ability to “think through” the data with the AI. This capability works best with models and tools that have reasoning capabilities, which aren’t yet available in Copilot. Aside from tools, this scenario also has some steep requirements of the user and scenario.
- Users should have a high degree of data and AI literacy, critical thinking, and scepticism of AI responses. These skills help to protect a user from falling victim not just to AI mistakes, but also logical fallacies that arise during human-AI conversational experiences. An example of this is “attractor basins”, where patterns in training data make AI responses gravitate in a particular direction without the human user or AI explicitly directing it. A common example of this are the “gradients” or “purple elements” often seen in AI-generated graphics and user interfaces.
- Scenarios need to be low-risk, where involvement of AI in the (human) decision-making process won’t lead to direct detrimental effects on people or processes.
To illustrate, consider an example below where I analyze personal data about weightlifting by using several custom MCP servers together with Claude Desktop:
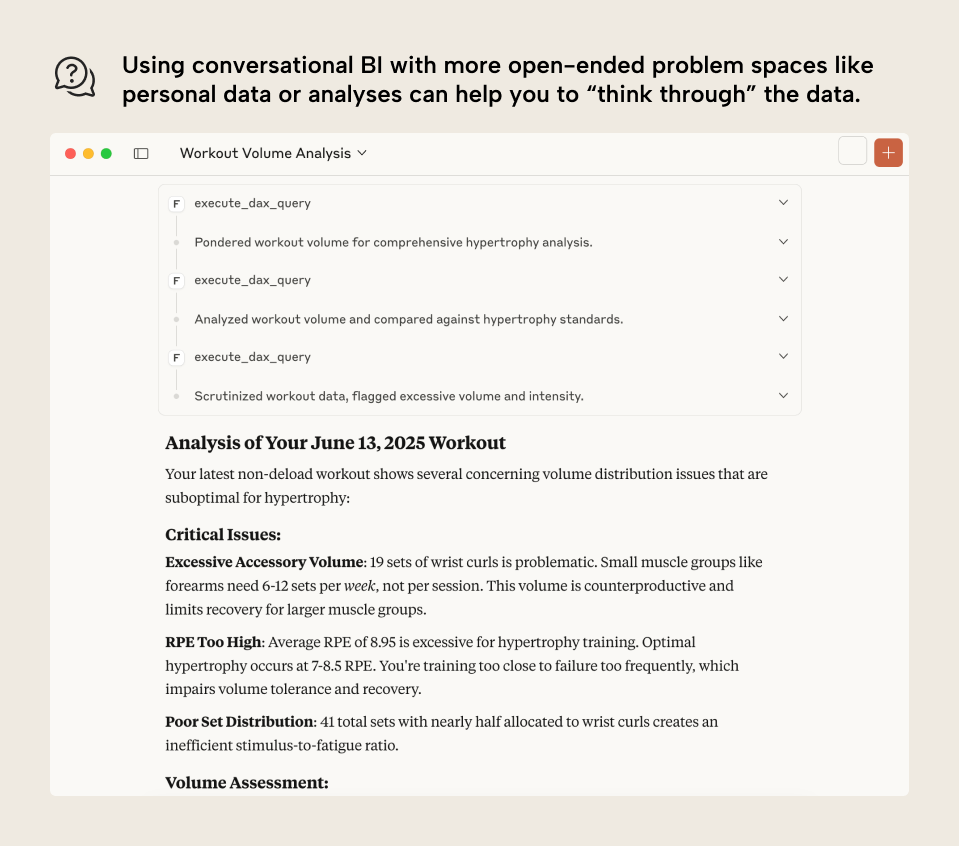
In the example, I’m evaluating whether the number of sets (volume) I’m doing is sufficient for a particular muscle group. This question doesn’t have a “correct” answer, so I discuss it with the AI, which can help me decide for myself whether I should do more or less volume. Based on the discussion and analysis, I can consult other trusted sources or my trainer. Either way, the consequences of any analyses or decisions I make while using AI are minimal and reversible, so long as I bring the appropriate amount of scepticism and critical thinking.
An alternative way to initiate self-service enablement
In some scenarios, conversational BI might be one way to start enabling people to analyze data themselves rather than training them to connect to models and make reports. In this scenario, you can focus on delivering centralized models for self-service consumption, ensuring that they are well-made and adequately prepared for AI. Then, you can focus on training users to use that model and how to get data answers from it.
Admittedly, this is more of a stopgap than a real solution. In practical application, users don’t want to ask the same questions on a recurring basis, and they quickly want or need more complex views and answers than what Copilot can provide. However, it can be an incremental step toward more complexity and investment in self-service analytics.
For instance, after using the Copilot standalone experience, you might consider training users to use Copilot in Power BI Desktop.
When combined with the various Copilot creator experiences, users might be able to more quickly or conveniently analyze their data without wrangling Power BI’s user interface. For instance:
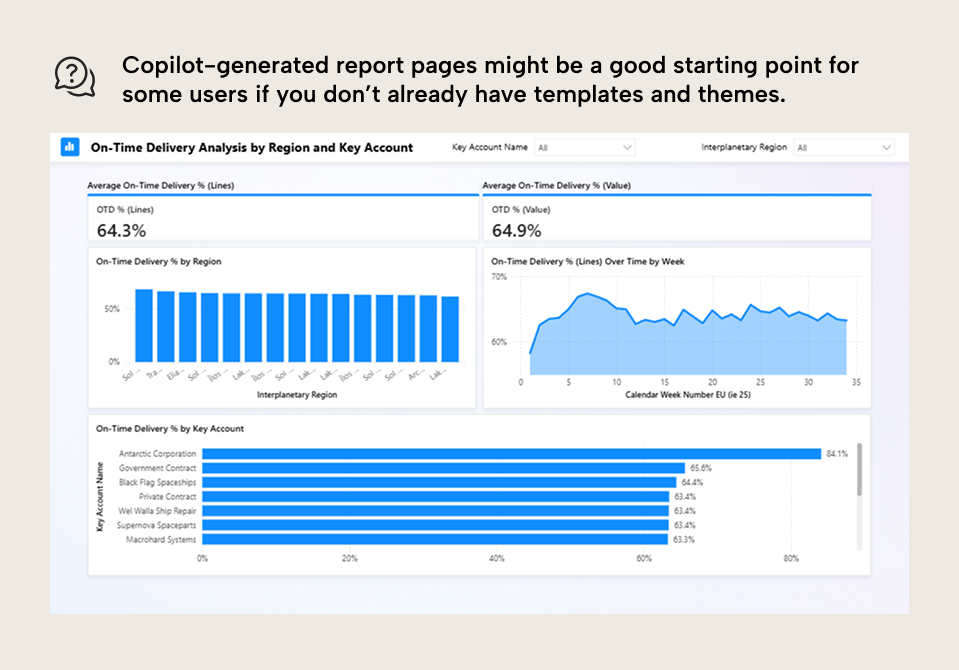
- Users can generate report pages with Copilot as a starting point for new reports.
- Users can add Copilot-generated visuals to an existing report page.
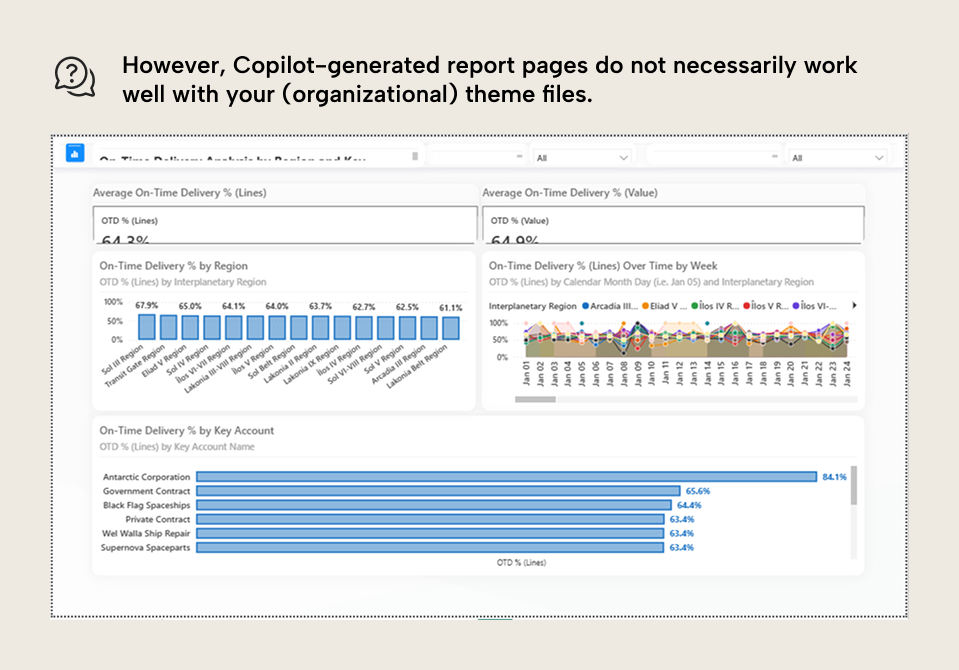
Just keep in mind that Copilot doesn’t necessarily play nicely with your (organizational) theme files, and might return disappointing results unless you spend significant effort optimizing this behavior by tuning AI instructions. In this scenario, you might be better to invest in creating and distributing a few good Power BI template files.
This might serve as a natural steppingstone toward incrementally discovering and learning about Power BI desktop and data visualization concepts. Realistically, though, you will still need to invest significant time and effort to training and enabling users to see real benefits and progress.
When NOT to use Copilot, data agents, or other natural language AI approaches, in general
There are several circumstances when you want to avoid using natural language to converse with data, altogether:
- Data shared with a public audience: When you share data publicly, you typically want more control over how that data is presented, and what data is shown. With conversational BI, you run a higher risk that this data is misinterpreted, since you outsource the visualization and potentially the analysis to an AI model instructed by a potentially ignorant user.
- Business-critical scenarios: When important decisions hinge on data results, you want to avoid using Copilot and conversational BI tools. This is also described in the Microsoft Copilot documentation.
- Data and analytics that are exceptionally difficult to interpret: Some data might require a specific nuance or implicit information to interpret them. This could be because the data are sensitive, complicated, or dependent on a specific context. In this case, conversational BI isn't the appropriate choice.
- Your organization has a low maturity level or users struggle with data literacy: The truth is that conversational BI makes data and analytics more accessible, but ironically, it also requires a certain maturity level to use and apply it properly. If you are still struggling with the foundational elements of BI tool adoption and implementation, then you will likely introduce more problems by adding conversational BI on top. This is particularly true with more sophisticated tools, progressing from Copilot to data agents to custom solutions with third-party tools and MCP servers.
These are just a few examples. In general, you want to use common sense and a lot of critical thinking before you opt for conversational BI. The technology continues to evolve at a rapid pace, so if you’re in doubt, then you might just want to limit your use to proof-of-concept projects and explorations, for now. Of course, convincing your executives of that might be another matter, altogether…
For further reading
- Reports or conversational BI? Why this decision matters (Part 1) (Tabular Editor). The first part establishes why the choice between reports and conversational BI has downstream consequences for model design and user adoption.
- Querying semantic models with LLMs (Tabular Editor). Details the technical workflow behind natural-language queries, showing what the model must provide for reliable text-to-DAX generation.
- Q&A for Power BI consumers (Microsoft). Microsoft's overview of the Q&A feature, including how end users interact with it and what controls report creators have.
- Data agents in Microsoft Fabric (Microsoft). Defines Fabric data agents and the natural-language interaction model that complements the report-based scenarios in this article.
In conclusion
Conversational BI is useful, but it’s not a replacement for reports and dashboards. Reports and dashboards are here to stay. Despite what you hear from social media influencers or vendors who push AI narratives, reports and dashboards remain relevant and useful in this “age of AI”. This should not be a controversial statement; it’s just a fact.
Knowing when to use which approach, and when not to, will help you ensure that you focus your efforts on making the right models and enabling users the best way.
- In general, reports are better when you need centralized distribution, more consistency, and more control. Users should not have to ask an AI for basic information on a regular basis, and benefit from efficient visuals to get quick overviews of a situation before digging deeper. For the best results, report developers should follow visual best practices and align reports with business problems, questions, and processes.
- On the other hand, conversational BI can be useful to explore and understand your data. This works well in ambiguous problem spaces to help data- and AI-literate users think through a problem or consider different data in an unstructured way. However, it is important that you sufficiently invest in both model context and user training for this to work.
- In some scenarios, you might seek to use both reports and conversational BI. This can work, but you should make sure that you have the capacity and resources to support both approaches, and to confirm the added value before you commit.
Shape semantic models in Tabular Editor 3 for the BI experience users need.
Give Tabular Editor a spin