Key takeaways
- Two ways to consume data: Users can read Power BI reports and pivot tables, or use conversational BI to ask natural-language questions that AI turns into DAX or SQL.
- Conversational BI won't replace reports: It's a growing approach for different problems, not a replacement for reports and dashboards.
- You usually have to choose: Reports and conversational BI suit different scenarios, and doing both at once costs more time, money, and user clarity.
- This decision matters: Choosing or prioritizing the right approach for a project shapes its design, cost, and adoption.
This summary is produced by the author, and not by AI.
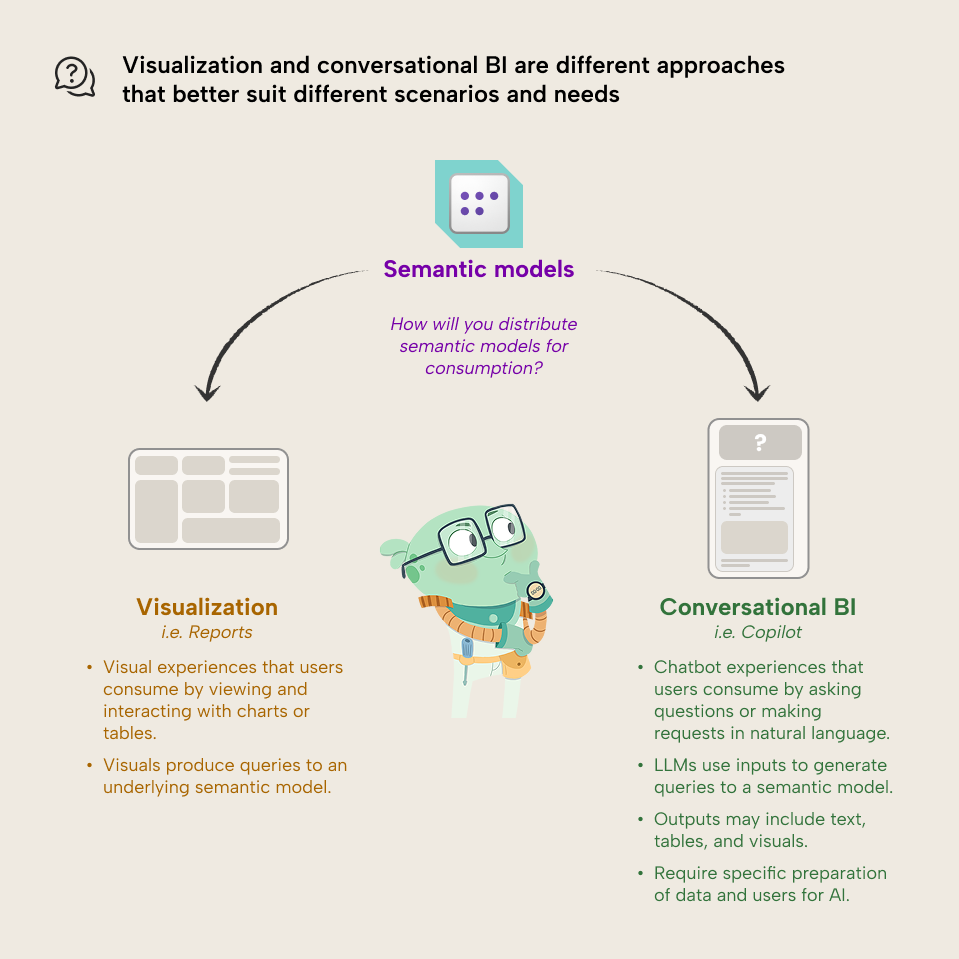
Today, most users consume semantic model data from Power BI reports or pivot tables. However, it's now also possible to engage with data by asking natural language questions, which AI can translate to DAX (for a semantic model) or SQL queries (for the underlying data items). As the technology behind this conversational BI approach improves, this will likely become a popular way to consume data. However, it will not replace reports and dashboards.
Reports, dashboards, and conversational BI are different approaches that address different problems. As such, they're suitable for different scenarios. For new projects, you will have to choose which to use (or which to prioritize). Doing both at once costs more time and resources. It can also create confusion for users about what they should use and why.
In this article, we discuss the possible options and explain why this is an important decision that you must make in your BI projects.
An overview of the available options
This decision doesn't just boil down to “reports vs. Copilot”. There are a variety of different approaches that one can take to visualize or chat with data in natural language from Microsoft Fabric and Power BI. Choosing which one to use is an important part of your project planning.
The following diagrams give you a concise overview of these options for visualization and conversational BI, respectively, before we pull back to focus on higher-level decision-making.
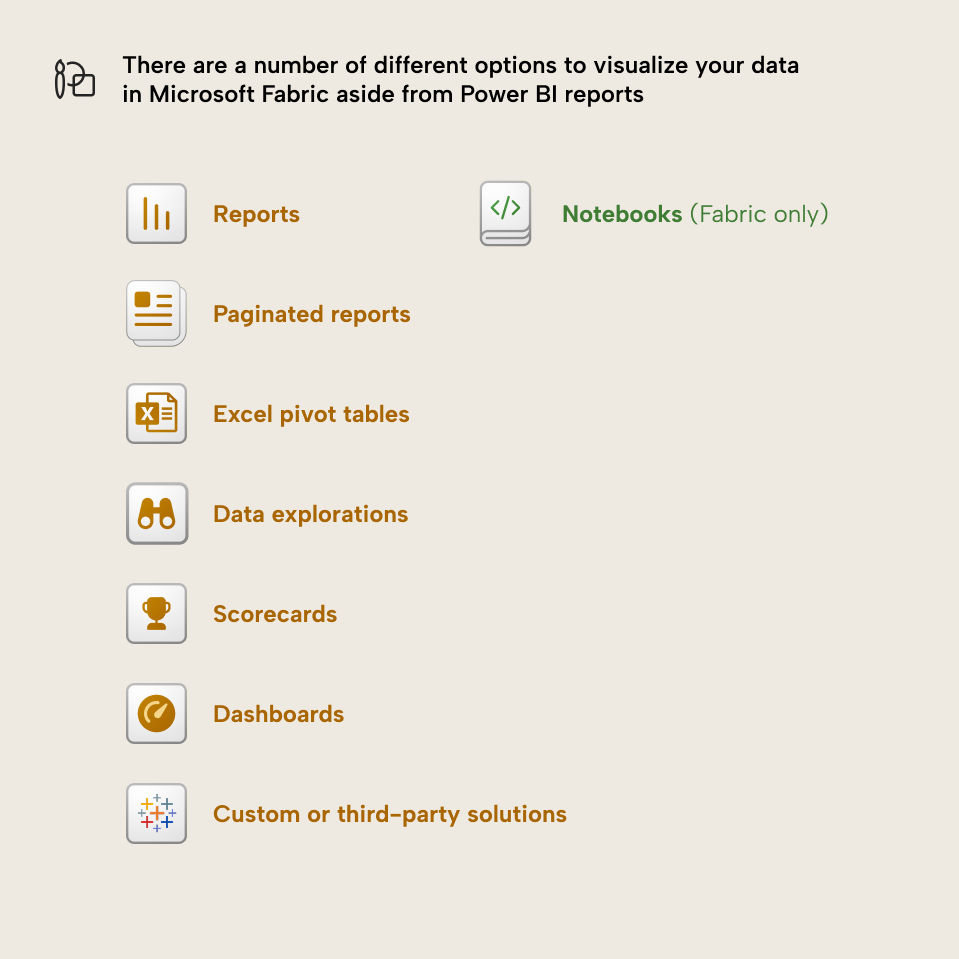
You can consume and visualize semantic model data for Power BI in the following ways:
- Reports: Best for most (not all) situations and interactive, dynamic analyses.
- Paginated reports: Best for multipage, static reports and delivery of scheduled exports.
- Analyze-in-Excel pivot tables: Best for when users are most comfortable in Excel, or want to explore and analyze data ad hoc or combine it with other Excel data.
- Data explorations: Best for simple ad hoc explorations of semantic models with a single visual, and validation of Copilot outputs.
- Scorecards (Formerly metrics… also formerly… scorecards?): Items for tracking individual KPIs against business objectives.
- Dashboards: Best for combining simple report visuals onto one screen. Note that dashboards haven't seen much support from Microsoft in recent years.
- Notebooks (only in Fabric; using Python or R): Best for statistical or advanced visualization approaches, limited data storytelling, or collaborative scenarios among users comfortable with code.
- Custom or third-party solutions (like Tableau or others): Circumstantially specific, and not typical for most “normal” scenarios.
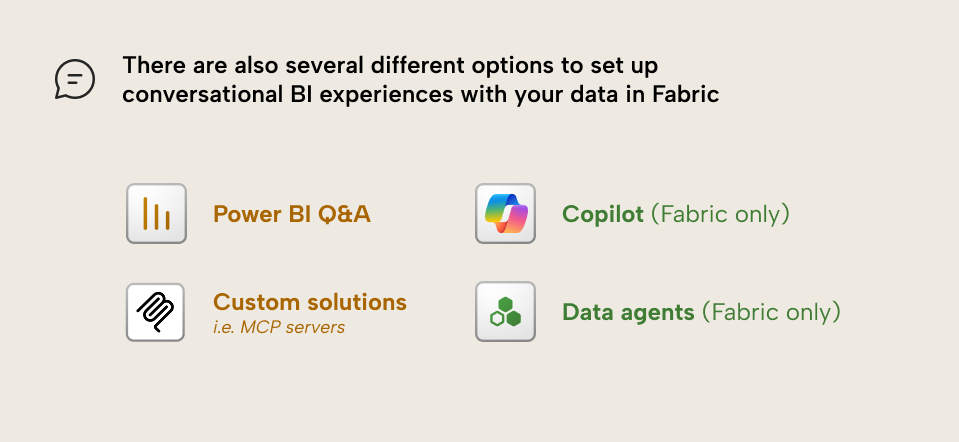
You can set up conversational BI experiences for semantic model data in the following ways:
- Copilot (only in Fabric): Best for most general-purpose scenarios where you don’t need advanced customization but still want to facilitate simple conversational BI experiences.
- Data agents (formerly AI skills; a new item in Fabric): Best when you want an out-of-the-box experience with more customization that might leverage other Microsoft services or data.
- Power BI Q&A: Best when you don’t have Fabric and you want a traditional, simplified natural language experience locked down to a single report page or dashboard.
- Custom or third-party solutions (like custom MCP servers or Copilot Studio): Best when you want full control over a customized solution, like choosing the LLM and context.
Each of these approaches require different efforts to implement. This is true both for the consumption layer itself (like building the report or the data agent) as well as the underlying semantic model being consumed.
What if you aren’t the one who makes this decision?
For both internal FTEs and external consultants, the decision might honestly just boil down to what they've been told to build; what business asks for:
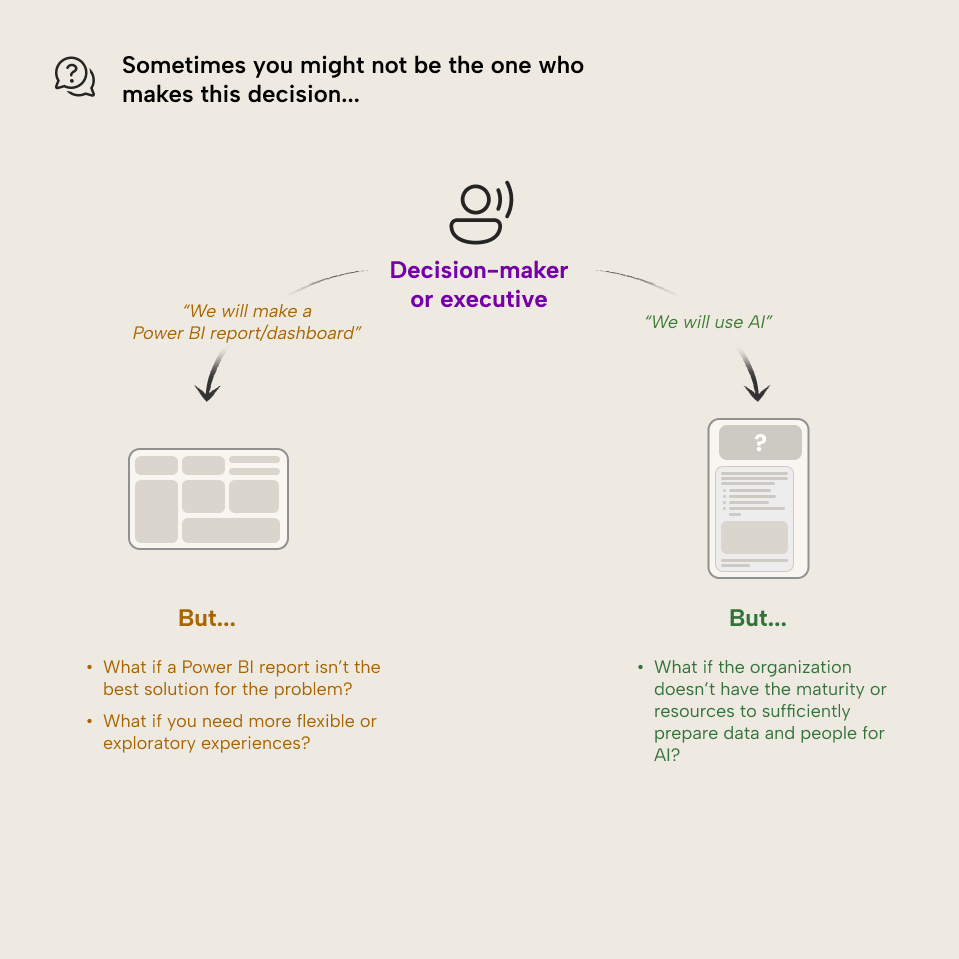
That's fair enough; sometimes, you're not in a position to choose. However, it's still important to help try and navigate this choice… even if you feel like it's not up to you. Your input can help to avoid wasting time and resources developing something that isn't a good fit for your users, data, or scenario. So, even if you're not the decision-maker, you still have the option to raise your concerns and put forward well-formulated arguments for an approach that could lead to better results and reduced cost:
- Make the wrong decision, and you'll waste time and money.
- Make the right decision, and you'll get more ROI from your BI efforts.
So, yeah… this decision matters. Let's talk about it some more.
Why this decision matters
Depending on how you will use your semantic model, you make different choices about its design, implementation, and lifecycle management. Furthermore, you also need to plan for different activities to drive user adoption, like training and support.
How will you plan, build, and support your semantic model?
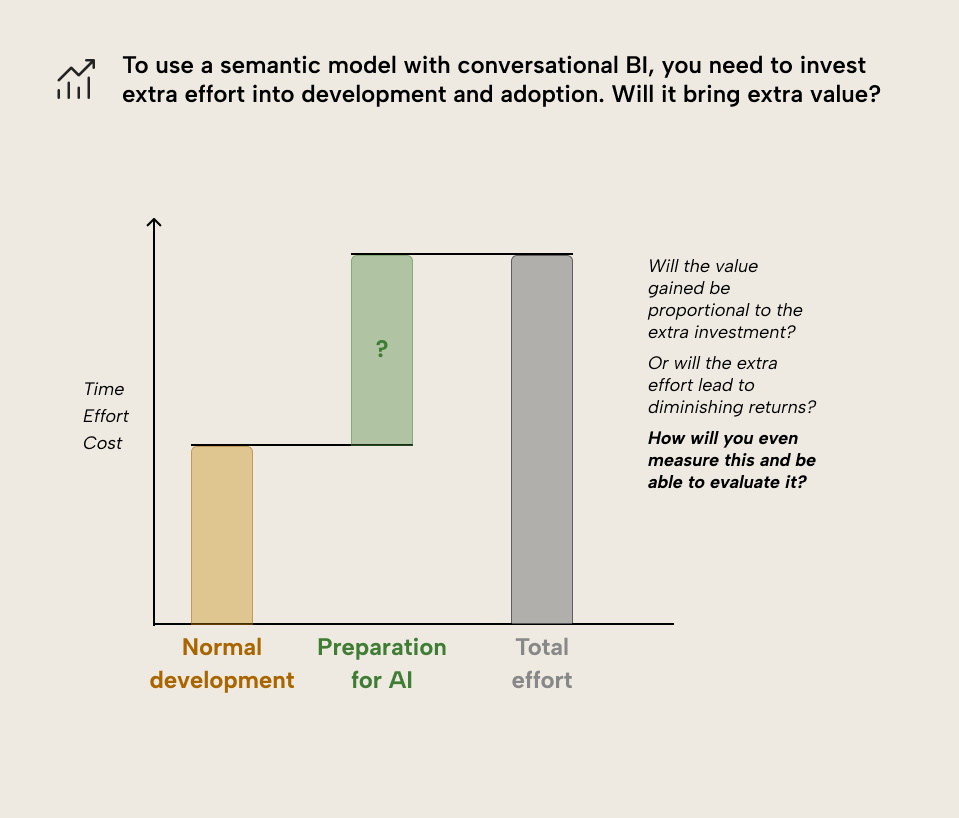
A semantic model uses different designs and requires different development efforts depending on how it will be used. This comes down to whether it's used for centralized reporting, human self-service analytics, and/or conversational BI with Copilot or other tools. For instance, successful use of your semantic model with Copilot requires extensive investment to prepare your data for AI:
- Planning and writing AI instructions.
- Setting up an AI schema: deciding which tables, columns, measures, and other objects should be accessible to Copilot.
- Planning and creating “verified answers” with report visuals.
- Configuring a linguistic schema, including synonyms, relationships, and other things.
- Setting descriptions optimized for AI context.
- Using English-language naming conventions and properties that work well with AI.
- …and much more.
These tasks can easily double the time it takes for you to make your semantic model. This is particularly true when you factor in iterative testing with Copilot to ensure you get the results that you expect. In extension, many of these tasks only provide a return-of-investment for Copilot usage. For instance, AI instructions aren't shared between Copilot and data agents (which use their own instructions) for the same semantic model. Custom MCP servers can't even read these instructions using APIs or XMLA endpoints.
So, if users will not use conversational BI (or if you don't have the time and resources to train them), then you don't want to spend the cost setting all this up and testing that it works. Conversely, if users will use conversational BI, then you must ensure that you plan for all of these tasks up-front. Missing even one or two actions when you prepare your data for AI might result in a significant degradation to the user experience.
Arguably, some of these tasks you should ideally do, anyway. For instance, using good naming conventions and setting descriptions makes your model easier to use for other developers and users. However, in practice, there can be significant differences about what this type of model organization and documentation looks like when you target a human user or an AI agent.
How will you ensure successful adoption of your semantic model?
Even if you have well-optimized semantic models and beautiful reports that follow all the best practices… if people aren't using them, then they aren't delivering value. Helping people to effectively use your models, reports, and conversational BI tools is called adoption. Adoption is incredibly important for successful use of data and analytics in an organization.
Attaining adoption isn't a passive task; it requires active investment and effort from both BI professionals and project sponsors.
The types of activities you need to undertake to drive adoption can range from user training and support to monitoring usage and addressing user feedback. These activities will look different depending on how people use the model. Consider the following examples for user training, which is only one facet of successful adoption.
With conversational BI, users need training regarding:
- Aspects of the underlying generative AI technology, covering topics such as:
- What types of questions and requests are appropriate for Copilot or other tools, and which are not likely to produce useful outputs.
- How responses are nondeterministic by default; the same inputs can produce different outputs.
- How to spot possible mistakes in responses from Copilot or other tools.
- How to troubleshoot or validate responses and mitigate the risks of AI mistakes, hallucinations, or misinterpretations.
- How to write prompts, how to save and use responses (such as starting explorations), and when to reset conversation history.
- When to use a data agent and when to use Copilot for the same semantic model data source.
- When to explore data with natural language, and when to explore it using other tools like reports, pivot tables, or explorations.
- When to use the different entry points, such as the Copilot pane vs. standalone “chat with data” experience. Also, how responses may differ depending on whether they receive a verified answer, a visual generated from a query, or a response from an ad hoc analysis and calculation that Copilot generates within a query.
- Aspects specific to the semantic model, such as data availability, nomenclature, etc.
These activities are fundamentally different from user training that you conduct with reports, which might include:
- The scope of the report, and where to find which data.
- How to read and interpret the specific visuals on a report page.
- How and when to use interactive elements, like cross-filtering, filters/slicers, drill-downs, drillthrough, personalize visuals, and others (depending on what is available).
- How to clear filter selections to restore the default view of the report.
- How and when to export data or view it as a table.
- How to explore data with more open-ended visualizations that leverage elements like cross-filtering, field parameters, and exploratory visuals like scatterplots or decomposition trees.
To be abundantly clear: successfully driving adoption is hard work that can take a lot of time and effort. It requires consistency, and it is not a technical problem that you can offload to AI. Like your implementation efforts, you want to be sure that you invest in adoption activities that align with how people want and need to engage with their data.
"Why not both?"
To be clear, we aren't trying to promote a false dichotomy. We're also not positioning reports against conversational BI… That would be silly… right?
There are certainly valid scenarios where you might opt for both reports and conversational BI. For instance, if you already have reports in place and a well-made model, then you may consider whether adding support for conversational BI usage scenarios will bring you more value. Here, you still need to understand what investment you need to make in model development and user training to do this successfully. You also want to evaluate clearly what added value this can bring on top of your reports… or whether it might be redundant with what you’re doing already.
Here your choice just looks different. Instead of choosing between reports or conversational BI, you might be choosing whether you invest time and resources into new enhancements and requests, or whether you add conversational BI support to an existing model.
For further reading
- Reports or conversational BI? How to make the choice (Part 2) (Tabular Editor). The follow-up article lays out the decision criteria that determine which output type fits a given scenario.
- Querying semantic models with LLMs (Tabular Editor). Explains the workflow from natural language input to DAX query execution, covering the model requirements that make conversational BI reliable.
- Q&A for Power BI consumers (Microsoft). Microsoft's overview of the Q&A feature, including how end users interact with it and what controls report creators have.
- Data agents in Microsoft Fabric (Microsoft). Defines Fabric data agents and the natural-language interaction model that complements the report-based scenarios in this article.
In conclusion
You should know how your semantic model is used so that you can plan its development and adoption accordingly. That way, you can prioritize designs, functionality, and activities that best support these use-cases. This will ensure that you align model consumption with business user needs. As such, you can be more confident that your efforts are more likely to lead to an ROI, and less likely to lead to increase cost from reworks, changes, and inevitably… piles of Excel files in users’ “downloads” folders.
In the next article, we’ll outline some criteria that might help you choose between using reports or Copilot; visualization and conversational BI.
Prepare semantic models for reports and AI chats in Tabular Editor 3.
Give Tabular Editor a spin