Key takeaways
- A slow-loading Power BI report with long refreshes can cause a lot of frustration.
- Luckily, there are plenty of ways to optimize your report, even if you’re a beginner.
- First, you need to define what the problem is before you can move on to using the Performance analyzer pane.
- The Performance analyzer pane will highlight which visuals cause slow loading, whether the problem is due to the report or the semantic model, and which field is causing the problem.
- When you know the reason for the slow loading, you can use this knowledge to fix DAX, model, and report problems and optimize refresh time and model size.
Slow reports. Long refreshes. Models too big to publish or refresh. These are common conundrums that many Power BI professionals know all too well. Performance problems are typically something that many of us encounter and react to when they happen, rather than prepare for pro-actively. For beginners to Power BI, it’s difficult to know how to solve this problem. Why is Power BI slow? What do I do to fix it?
In this article, we give a simple guide and reference about what you might do to improve performance, focusing on what to do and where to look first, and linking to some other, helpful resources. This isn’t a comprehensive guide, but an introduction focusing on the most common culprits.
If you find this helpful, you might also be interested in this article: Power BI for beginners: 7 mistakes you don’t want to make. Microsoft also has a useful article: Optimization guide for Power BI.
Diagnosing the problem
First things first, you need to define the problem. Typically, this comes in three flavors of performance symptoms:
- Reports are slow: This is when users find that visuals take too long to load or time out (with the fabled “grey box of death”). It can affect not just reports but other ways of querying data, like Analyze-in-Excel pivot tables, paginated reports, and so on.
- Refresh is slow: When your refreshes are taking too long or failing altogether with errors.
- Models are too large: When the size of your model is too big for your Power BI environment, and you get errors when trying to publish or refresh a model.
Optimize reports
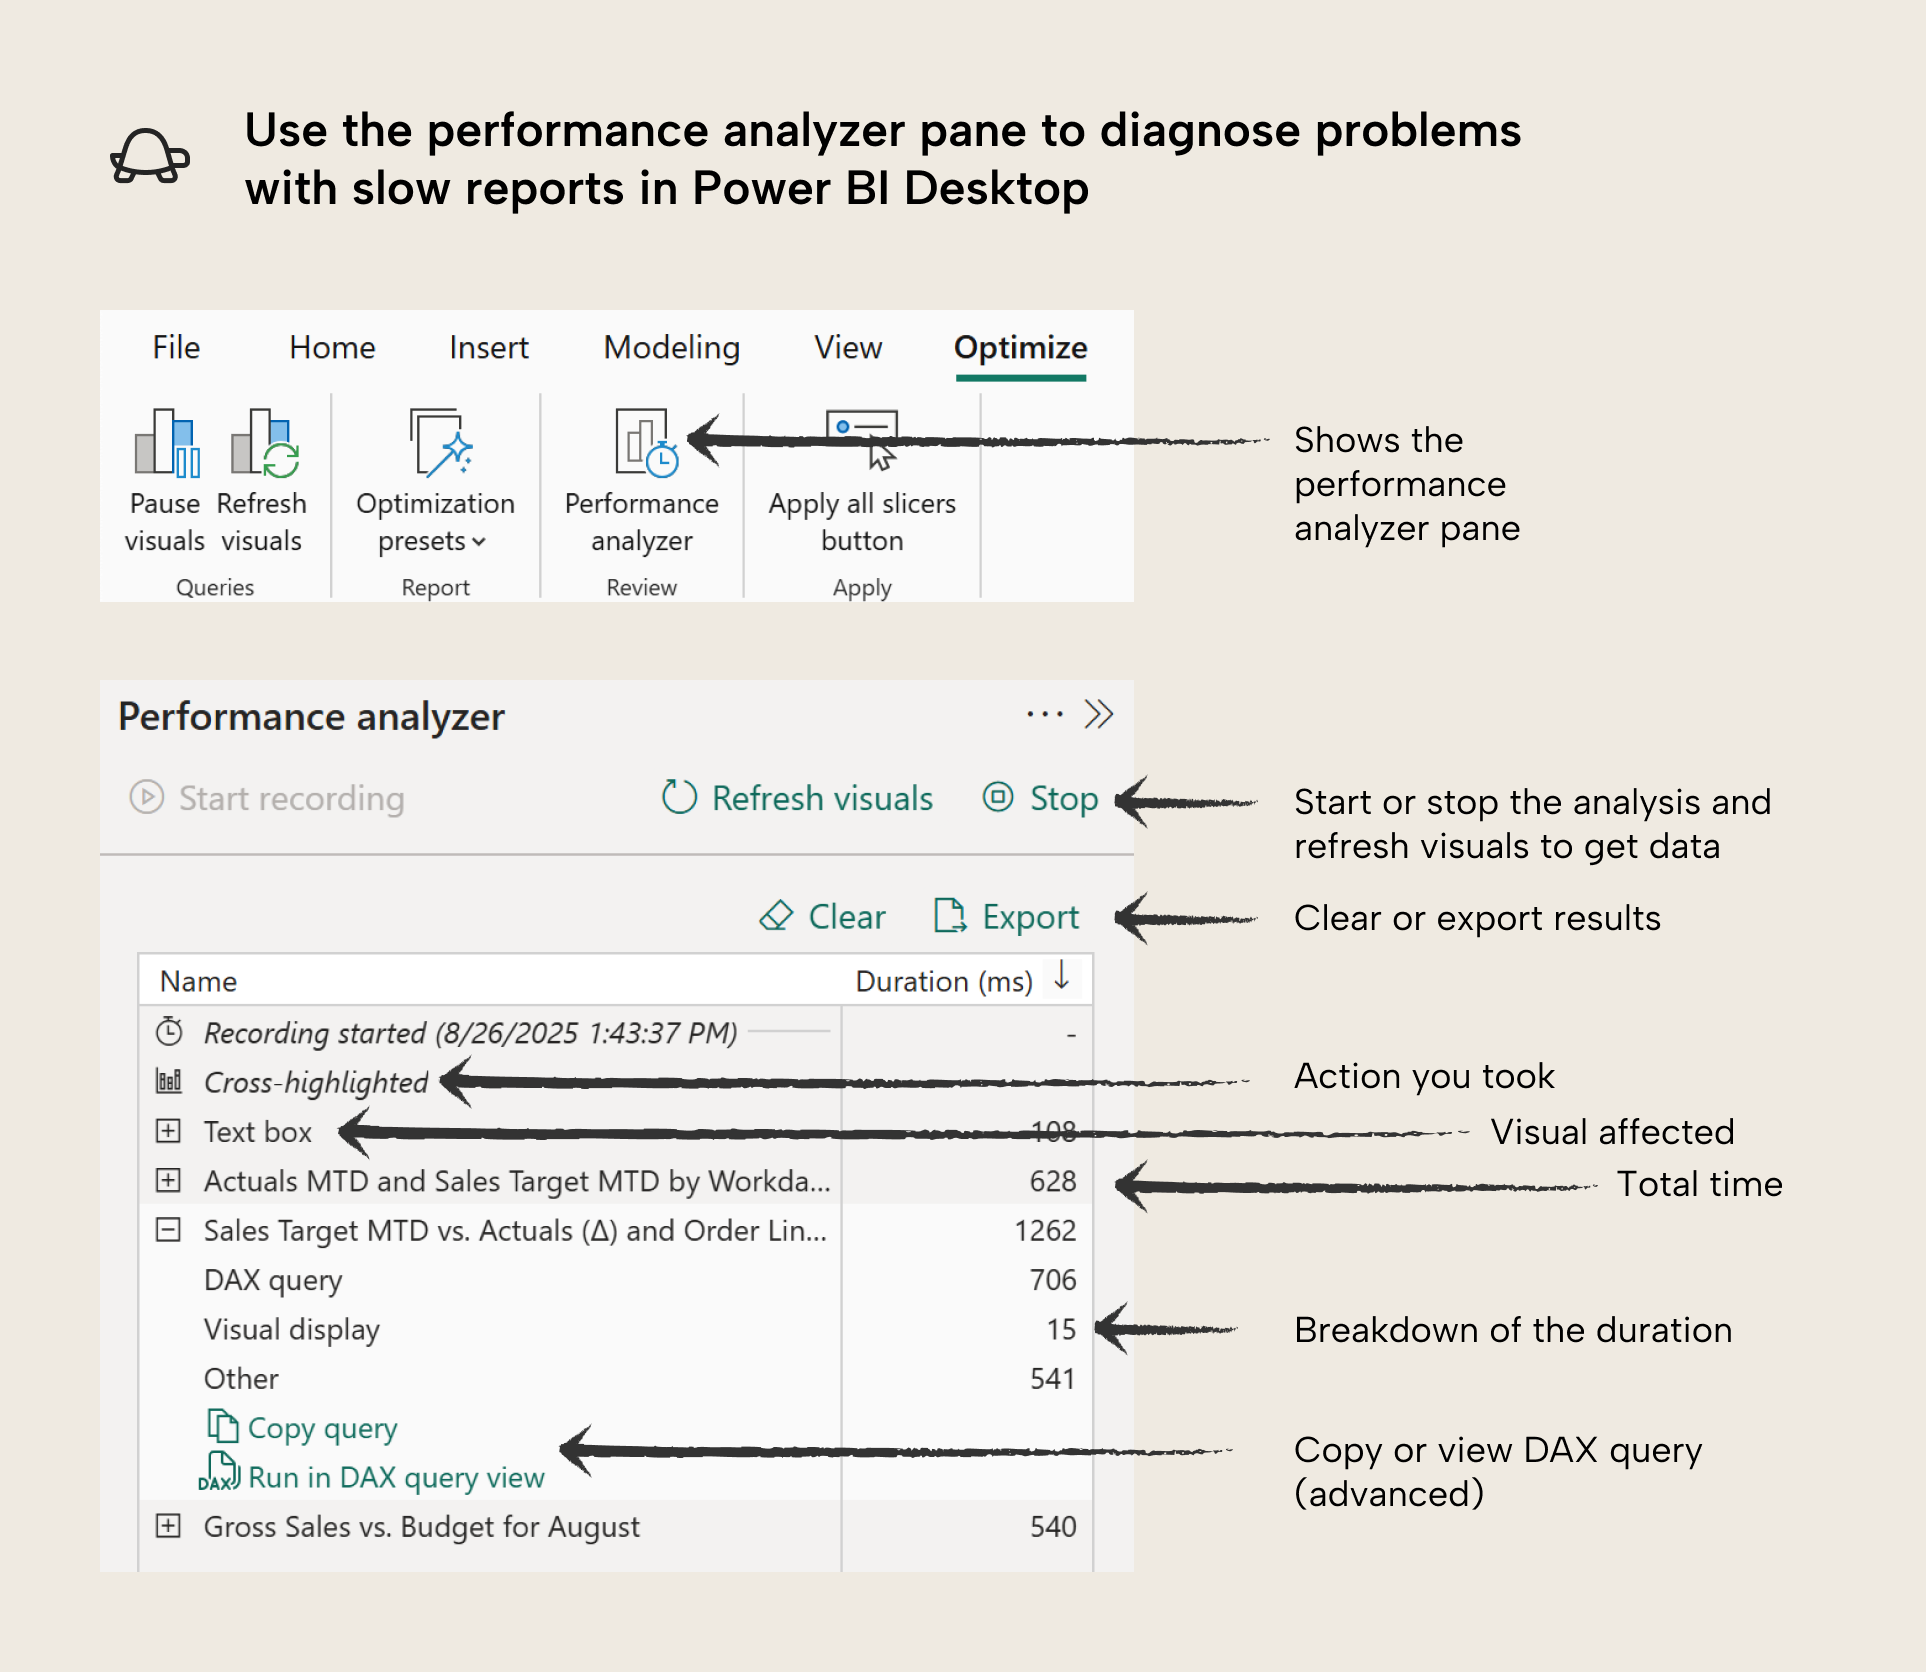
The performance analyzer can be quite overwhelming at first, but don’t worry. The purpose of it is just to measure how long that takes for the visuals to show data in milliseconds (Duration). Measuring this is easy to do:
- Click “start recording” to begin measurements. Henceforth, whenever you change something in the report, it will measure the duration for each visual on the page.
- Reproduce the actions that users take when the report is slow. If you repeat actions multiple times, you will notice that subsequent tests are faster. This is because the semantic model is caching the results of the first query to improve performance. It is a good idea to test multiple times to account for variation due to uncontrollable factors, or to see if changes you made are having an impact.
- To avoid the cache, you can place different filters on the report while measuring.
- Alternatively, you can clear the cache with a more advanced tool DAX studio by clicking the clear cache button.
- To avoid the cache, you can place different filters on the report while measuring.
- Find slow visuals and export the query results (for documentation).
The main goal of the performance analyzer is to answer the following questions:
- Which visual is a problem, if you don’t know already? To answer this question, you just want to focus on the visual that takes the longest to render.
- Is the problem due to the report or the data model? When you expand a visual in the performance analyzer, you will see a breakdown. It is likely that the DAX Query is the largest value, but if it is not, then the problem might be due to the report. Note that Other contains operations and factors that are typically outside of your control.
- What field might be the problem? Often, performance issues are due to your DAX measures. However, it might not be clear what measure is causing the problem. You can compare visuals with different fields to help you figure this out. You can also re-test before and after removing different fields. It helps to test along a measure’s dependency chain. For instance, if a visual with Sales by Workday MTD (PY) is slow, try testing the upstream Sales by Workday MTD, Sales by Workday, and Sales measures (if they exist).
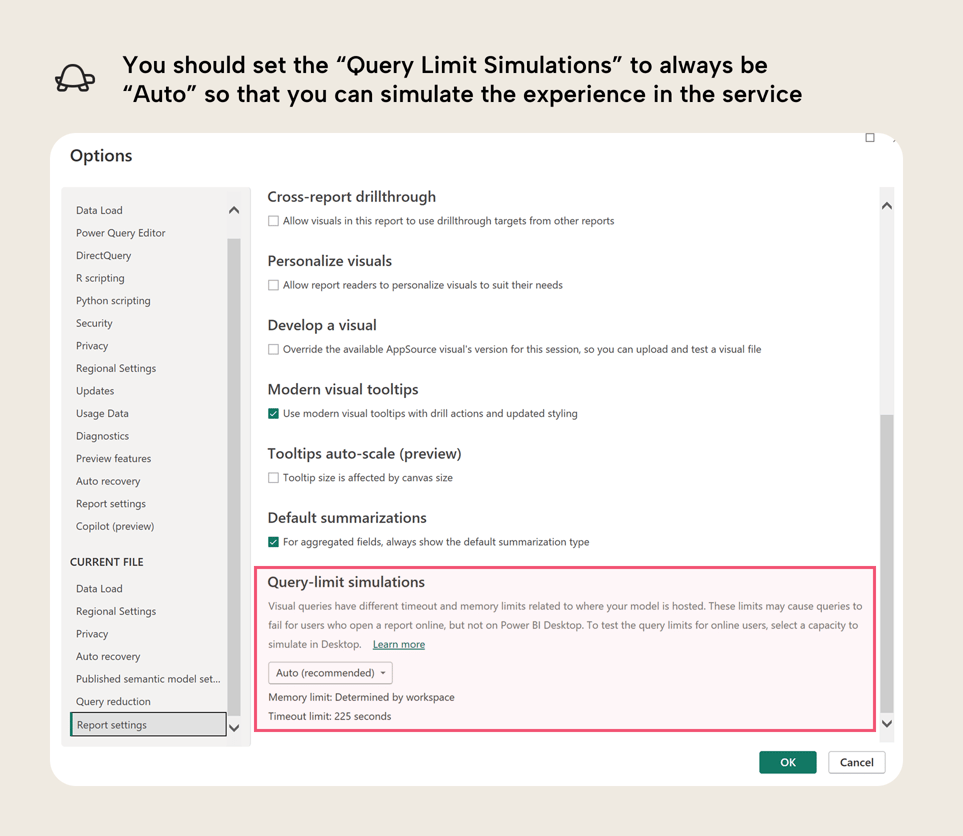
In addition to the performance analyzer, you can also run query limit simulations to ensure that the memory limits in your testing are the same as in the Power BI service or Fabric.
Fixing DAX problems
NOTE
If you would like some examples with code, please see the referenced articles. There are great examples and further detail, there for you to better understand, if you need to!
- Not using variables for re-used calculations: Variables can be helpful to avoid circumstances when you evaluate a measure multiple times, unnecessarily.
- Not understanding filter context and row context when you write complex DAX: These fundamental concepts are necessary to understand when you move beyond the basic scenarios with DAX. This is important not just for performance, but also to get correct results.
- Excessive use of conditional statements (with IF) for exceptions and other scenarios: Use of IF statements can lead to performance problems when you do not handle them properly.
- Filtering tables rather than columns: When you try to filter a table instead of a column in a CALCULATE or CALCULATETABLE filter, you can get performance issues when dealing with larger and more complex data.
- Overcomplicating things: Once your DAX becomes overly-complex, it might be worth stopping to evaluate whether you might structure your data (or your model) in a simpler way to achieve the same result. If your DAX is overly complicated to meet a specific visual requirement, then you might want to consider whether a different, simpler design is better, too.
You can also use specialized tools or courses specifically designed to identify and resolve DAX performance bottlenecks, like the DAX Optimizer from SQLBI or SQLBI courses and paid content (please note the conflict-of-interest disclaimer that the author is professionally affiliated with SQLBI).
Fixing model problems
Sometimes you write complex DAX to overcome flaws with your data model. Here are a few things to look out for:
- Not going with import storage mode: In most scenarios, Import storage mode should be your default (when you load data from a data source into memory in Power BI). DirectQuery is much slower than import models, and you should avoid using it unless you really have strict requirements like a high demand for data freshness. Alternatively, if you have Microsoft Fabric, Direct Lake might also be a better choice for you than DirectQuery. See this comparison table for details.
- Not having a date table: If you want to report on data with dates, then a date table is important. It will ensure that your time intelligence calculations work as you expect.
- Bi-directional and many-to-many relationships: These relationship types might be required for advanced scenarios, but you should avoid them if you do not understand the possible caveats. For instance, bi-directional filtering is not a good way to sync/filter slicer values.
- Not working toward a star schema design: Once your data reaches a certain complexity and size, you should try to ensure that your model follows a star schema (or snowflake schema) design. Power BI performs best with a star schema, and it will also help your model be more organized, and easier to use.
- Overcomplicating things: Like with DAX, you might be overcomplicating your model design. For instance, if you are using composite models or calculation groups without an explicit reason to do so. Another example might be if you are bending and twisting your data model to try and accommodate certain reporting requirements. In that case, you might want to evaluate whether simpler report design can answer the same questions more effectively.
If you need some more help, consider checking our free trainings at Tabular Editor Learn.
Fixing report problems
Your problem is likely in the DAX or data model. However, it could be in the visual in the following circumstances:
- Your visual configuration or design is too complex. This reason is (in my experience) very common, but often misdiagnosed as a model or DAX problem. Often, slow reports arise not because of a model or DAX, but because we try to bend the Power BI visuals to our will so we can fulfil a particular business requirement. Power BI visuals are quite rigid and it can take a lot of effort to get the data to show exactly how you want. However, when the report arrives with users, it might buckle when being filtered. Once you run into performance issues, you should generally try to backtrack to simpler designs, or consider custom visuals. This article and video explains what to do when you run into visual roadblocks. Here are a few things to watch out for:
- Placing too many columns and measures in tables and matrixes.
- Using complex calculation logic for conditional formatting.
- Setting up too many dynamic parameters or too much conditional formatting.
- You are trying to replace (Blank) with zero, show categories with no data, or conditionally hide or highlight certain data points.
- You are using visual calculations in DAX that are causing the problem. In this case, you might want to adjust the visual calculation, or consider moving it to a thin-report or model measure, if it is feasible. Although, visual calculations in DAX generally can perform better, since they operate on a subset of the data just in the “visual dataset”.
- You have too many visuals on one page (over 12-16 visuals can become problematic). In this case, you want to reduce the number of visuals. This is also just a good rule-of-thumb to keep your reports simpler, both for users and for maintenance purposes.
- You are using custom visuals that are not as well-optimized as core visuals. In this case, you might want to consider alternative approaches.
- You are performing visual-level data calculations or transformations in custom visuals that you use in Python, R, Deneb, or JavaScript. In this case, you have to optimize this code.
These are just a few tips to improve performance of reports. If you want more details, please let us know in the comments of this article, and we can create a follow-up article.
Optimize refresh time
When you import your data, you might have issues with refresh time. Here are some tips to improve the refresh of your data in Power Query:
- If you are using a supported data source like a SQL database, make sure you are using query folding. Query folding is a feature in Power Query where the query sent to the data source can be “folded”, meaning that it pushes part of the query to the source system rather than having Power BI do the heavy lifting. Some steps “break” query folding, so you want to make sure that if you are doing transformations, make sure that they happen before that step. Specifically, filter and select columns as early as possible.
- Transform upstream where possible, and downstream when necessary (Roche’s Maxim): Often, slow refreshes happen simply because you are trying to get Power BI to do too much transformation. Power Query is simple and convenient, and it works for many scenarios. However, as you scale in size and complexity, Power Query alone likely won’t be enough for your use-cases. Instead, consider whether other tools might be better suited to the transformations that you want to do.
- Follow Power Query best practices: There are a lot of resources that provide guidance about Power Query, including tips like avoiding expensive operations such as sorting and joins, and filtering early then doing these operations last, if you must use them.
- Consider incremental refresh: You might be refreshing an entire large table every refresh, unnecessarily, when you only need to get the data from the last workday, week, or month. In this case, you might consider setting up incremental refresh. This splits up your table into parts (called “partitions”) and only refreshes the latest one according to some rules you set (called a “refresh policy”). Incremental refresh is complex to set up the first time, but it is a fantastic feature that is very helpful when you need it. Note that incremental refresh is only useful in cases where the logic can “fold” to the data source. For more information, see the previously mentioned point about query folding.
- Check the data gateway: If you use a data gateway, then you might need to ensure that it is set up and configured properly. For instance, you might have issues with concurrent refreshes, which could be better managed if you have a gateway cluster rather than a single gateway, which is a single-point-of-failure. This can be quite a complex technical topic if you’re using gateways for the first time. For more information, see the linked article.
Optimize model size
Depending on the license mode of your workspace (Pro, Premium Per User, or Fabric capacities), you have different size limits. It sometimes happens that people want to upgrade from Pro to PPU or Fabric (or upgrade their Fabric Capacity SKU) because their model is too big to publish, or has gotten too big to refresh. However, in many cases, this problem could be solved by simply optimizing model size. Furthermore, model size can also impact performance; in general, a good way to optimize your model is to start by reducing its size.
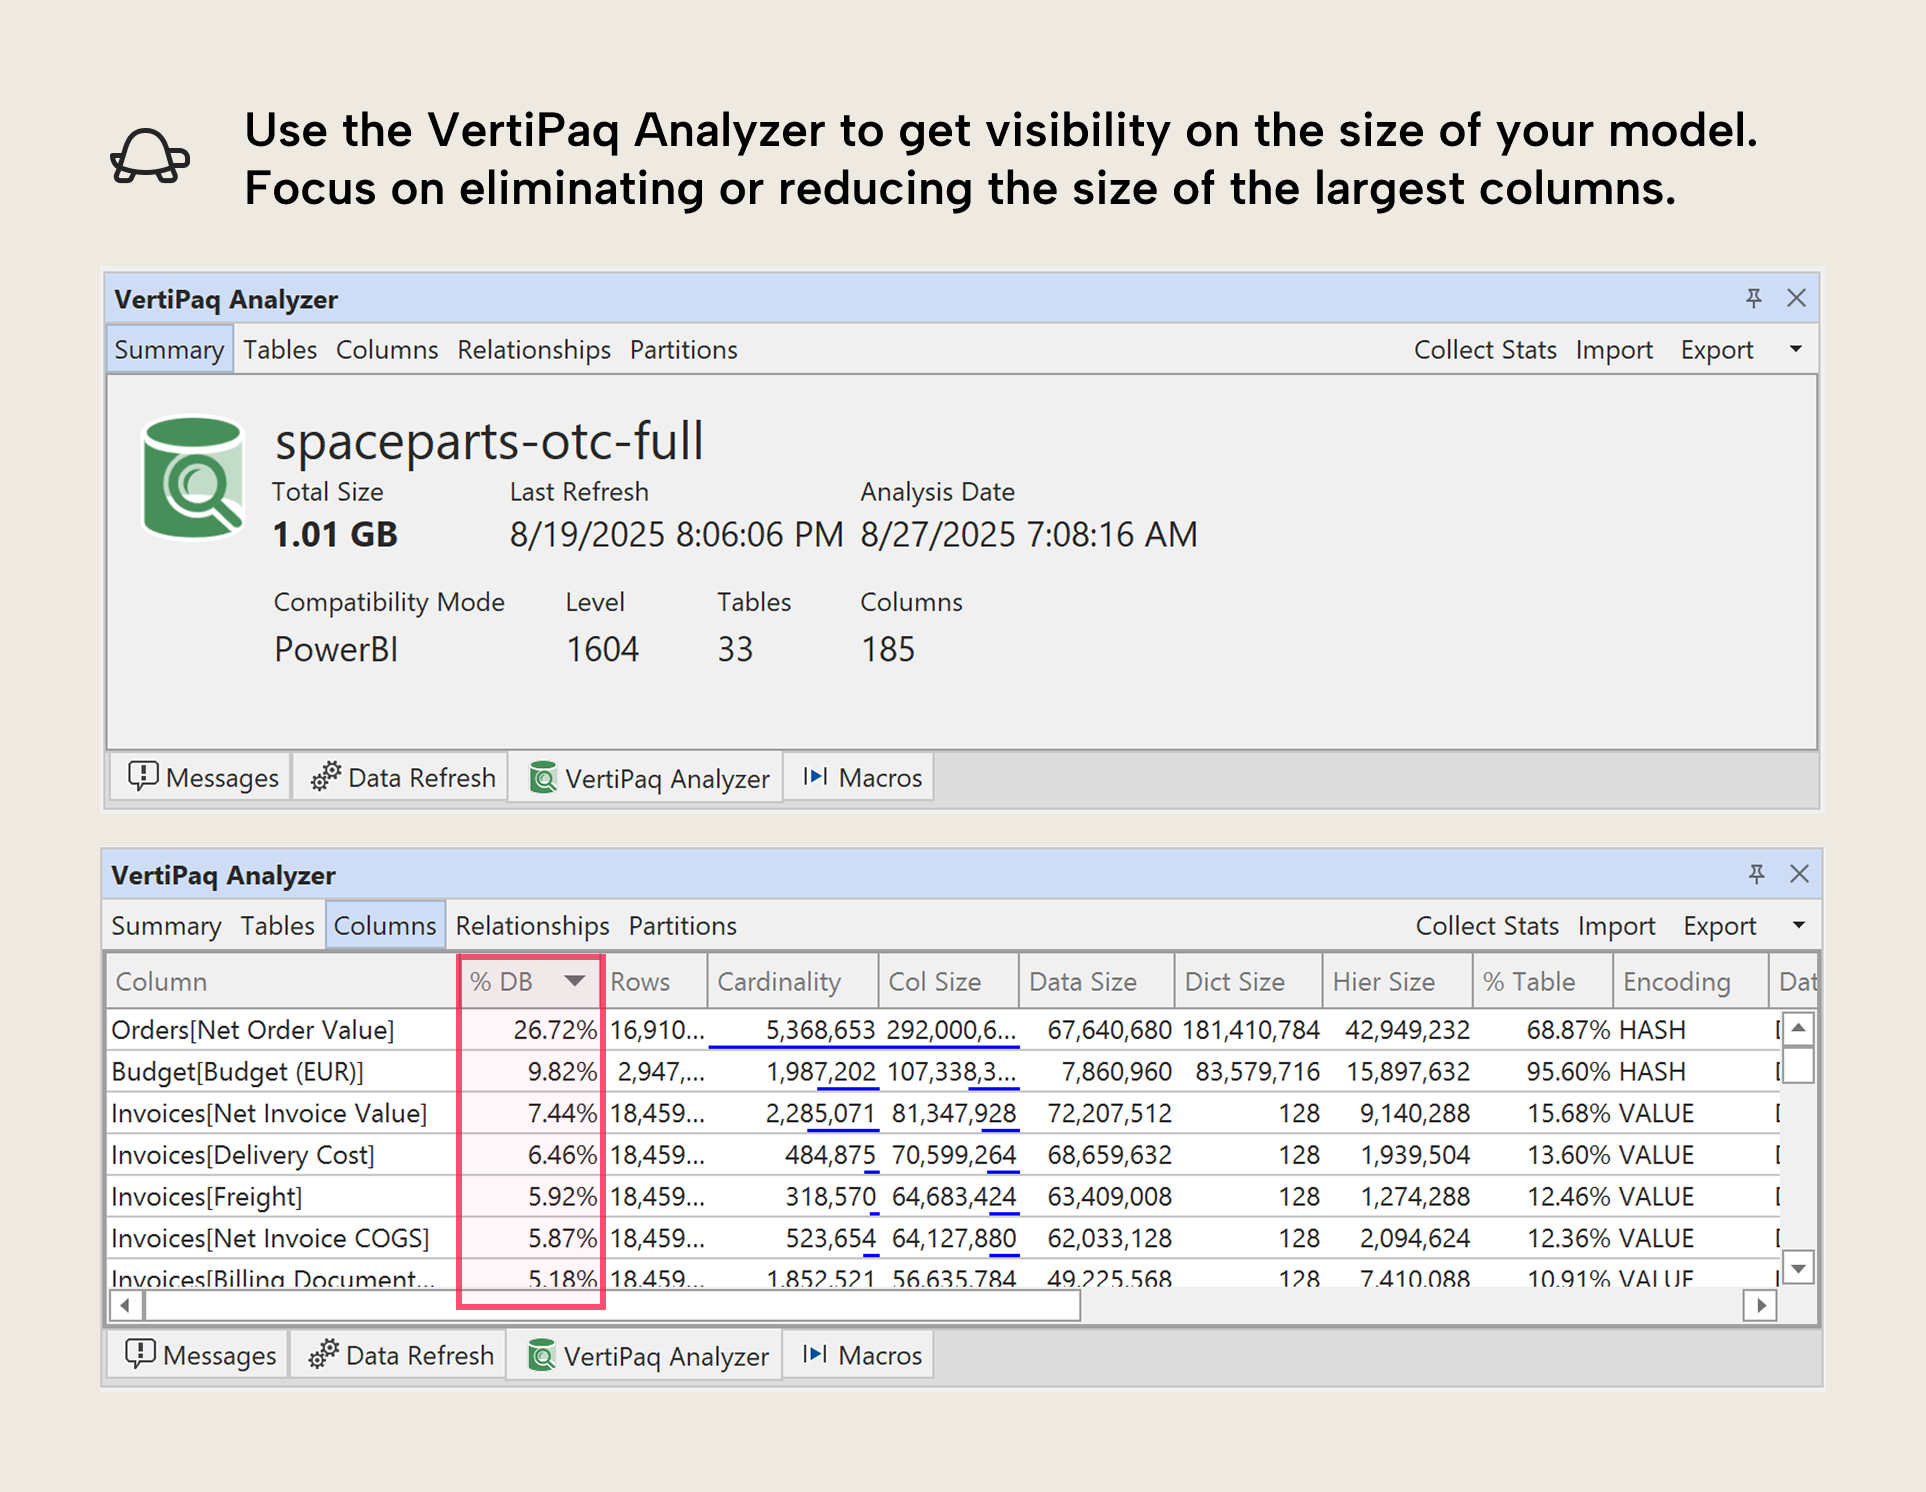
To check a model’s size and get a breakdown by column, you can use the VertiPaq Analyzer. The VertiPaq Analyzer is available in Tabular Editor 3, DAX Studio, and as a standalone tool (with a user interface or in the command line). If you want guidance on how to use it, we explain it in our free training courses here (specifically, the course analyze and optimize your model).
In general, the VertiPaq Analyzer gives you an overview of what is taking up so much space in your model. That way, you can either remove or reduce the size of those columns. There’s a lot more useful information there, but if you’re new to VertiPaq Analyzer and you find this overwhelming, just focus first on the “% DB” column in the “Columns” tab:
Microsoft has a good guidance article about this topic that you can also read. Some ways to reduce model size include:
- Limiting data to only what you need: It’s common to include data that you “might need” for a particular analysis or report (or that users might need in self-service scenarios, or via Copilot…) but you want to try to be as conservative as possible. You can always add more, later. Some ways to limit data include:
-
- Removing tables and columns that you won’t use.
-
- Filtering rows to just the periods and categories that you will report on.
-
- Pre-aggregating data to the detail level you will report on. This doesn’t just include dimensions (like aggregating Product Material Number up to Product Type) but also your fact tables. For instance, if you have an Orders table, why include cancelled orders if you won’t report on it, and are just using it in a calculation? Consider instead doing those calculations and transformations upstream. This will also keep your DAX simpler.
-
- Reduce decimal precision of columns.
- Avoid redundancy: This can happen when you work with multiple tables, where similar or identical fields occur multiple times. For instance, the Ship Date might be in both the Invoices and the Orders table; but does it need to be in both? Can you use it in just one?
- Disable Auto Date/Time: By default, Power BI will include a “hidden” date table for each date field in your model. These tables create the “date hierarchies” for these fields, and they can be very convenient for beginners, since they don’t need to create and use a date table. However, if you have a lot of date fields – especially ones that have wide ranges – then these hidden “auto date/time” tables can take up a lot of space. Disabling auto date/time will remove these tables, but you then need to create your own Date table, instead. Generally, the latter is recommended for most scenarios.
- Separate high-cardinality columns (like date and time fields): Power BI models are big because of column cardinality (the total number of unique values in a column). One way to reduce cardinality is to split up one column into several, without losing data. For an example, related to the previous points, if you have time data, then you should really think hard about whether you really need it. Most of the time, you don’t. But if you do, you should strongly consider splitting the date and time fields into two columns. This will reduce the size of the model because it reduces the total cardinality between these two columns.
- Disable the property IsAvailableInMDX for columns if you won’t use Excel on your model: This tip is admittedly already more advanced; however, it is still worth mentioning. If you will not query your model using MDX (which happens when you use pivot tables in Excel with a Power BI data model) or use the property SortBy (i.e. to sort the month name by the month number) then you can disable the column property IsAvailableInMDX. This will reduce the size of columns, because they don’t need to create a dictionary.
- Use integer or numerical data types for numbers (and not text/string): If your column is a number and you save it as text, it will take up more space than if you save it as an integer. An example might be the Billing Document Number column. Note that this will not always work, such as when the column is used in a relationship or when the number has a lot of inconsistent ranges. That’s because of how the model compresses data.
Note that many of these we copy directly from a related, earlier article.


