.jpg?width=50&height=50&name=Johnny%20Headshot%2005%2013%20Low%20Res%20(10%20of%2013).jpg)
Key takeaways
- Explore your data before modelling: Before connecting Tabular Editor, dig into what data is available, how it's structured, and which tables and columns are useful.
- Unity Catalog helps you understand the data: Use the catalog overview, entity relationship diagrams, sample data, and lineage to get to know your tables.
- Databricks SQL lets you query and validate: Run queries in the workspace and inspect metadata to confirm relationships and reconcile your model later.
- Some setup still comes first: You'll need to configure the SQL Warehouse and install additional software before connecting Tabular Editor to Databricks.
This summary is produced by the author, and not by AI.
Data discovery first
Borp now has access to a Databricks workspace. Before connecting Tabular Editor or building a semantic model, they need to understand what data is available, how it is structured, and which tables and columns are useful for Power BI modelling.
Databricks includes several tools for this discovery work. This article focuses on Unity Catalog and Databricks SQL: where to inspect metadata, sample data, review lineage, and run validation queries.
This article is part 3 of the series; part 2, What is Databricks? A guide for Power BI developers explains the Databricks platform and the lakehouse concepts behind this discovery work.
Unity Catalog for data discovery
The term “catalog” (or some prefer “catalogue”) is bandied about in a few different contexts in data circles.
An Enterprise Data Catalog is something like Microsoft Purview or Collibra. These are products that help you monitor and keep an inventory of your data, including descriptions and lineage.
The other term you may encounter is Metadata Catalog. These are a feature of Open Table Formats (see the Databricks overview for an overview of Open Table Formats) and are used as an abstraction layer on top of files to allow users to browse and interact with them as if they were tables in a database. A Metadata Catalog is a system that tracks and manages the metadata required to operate on these tables across multiple engines and environments. It’s the glue that binds compute engines to the data lakehouse.
Unity Catalog is the metadata catalog created by Databricks. However, Databricks have blurred the line between metadata and enterprise data catalogs as they have built in features which you might associate more with an enterprise data catalog.
You’ll see the Catalog explorer view pop up in several locations in the Databricks UI, but there’s also a dedicated Catalog area. Information on the Catalog experience in Databricks is available here, but we’re going to focus on five of the tabs; Overview, Permissions, Sample Data, Lineage and Insights.
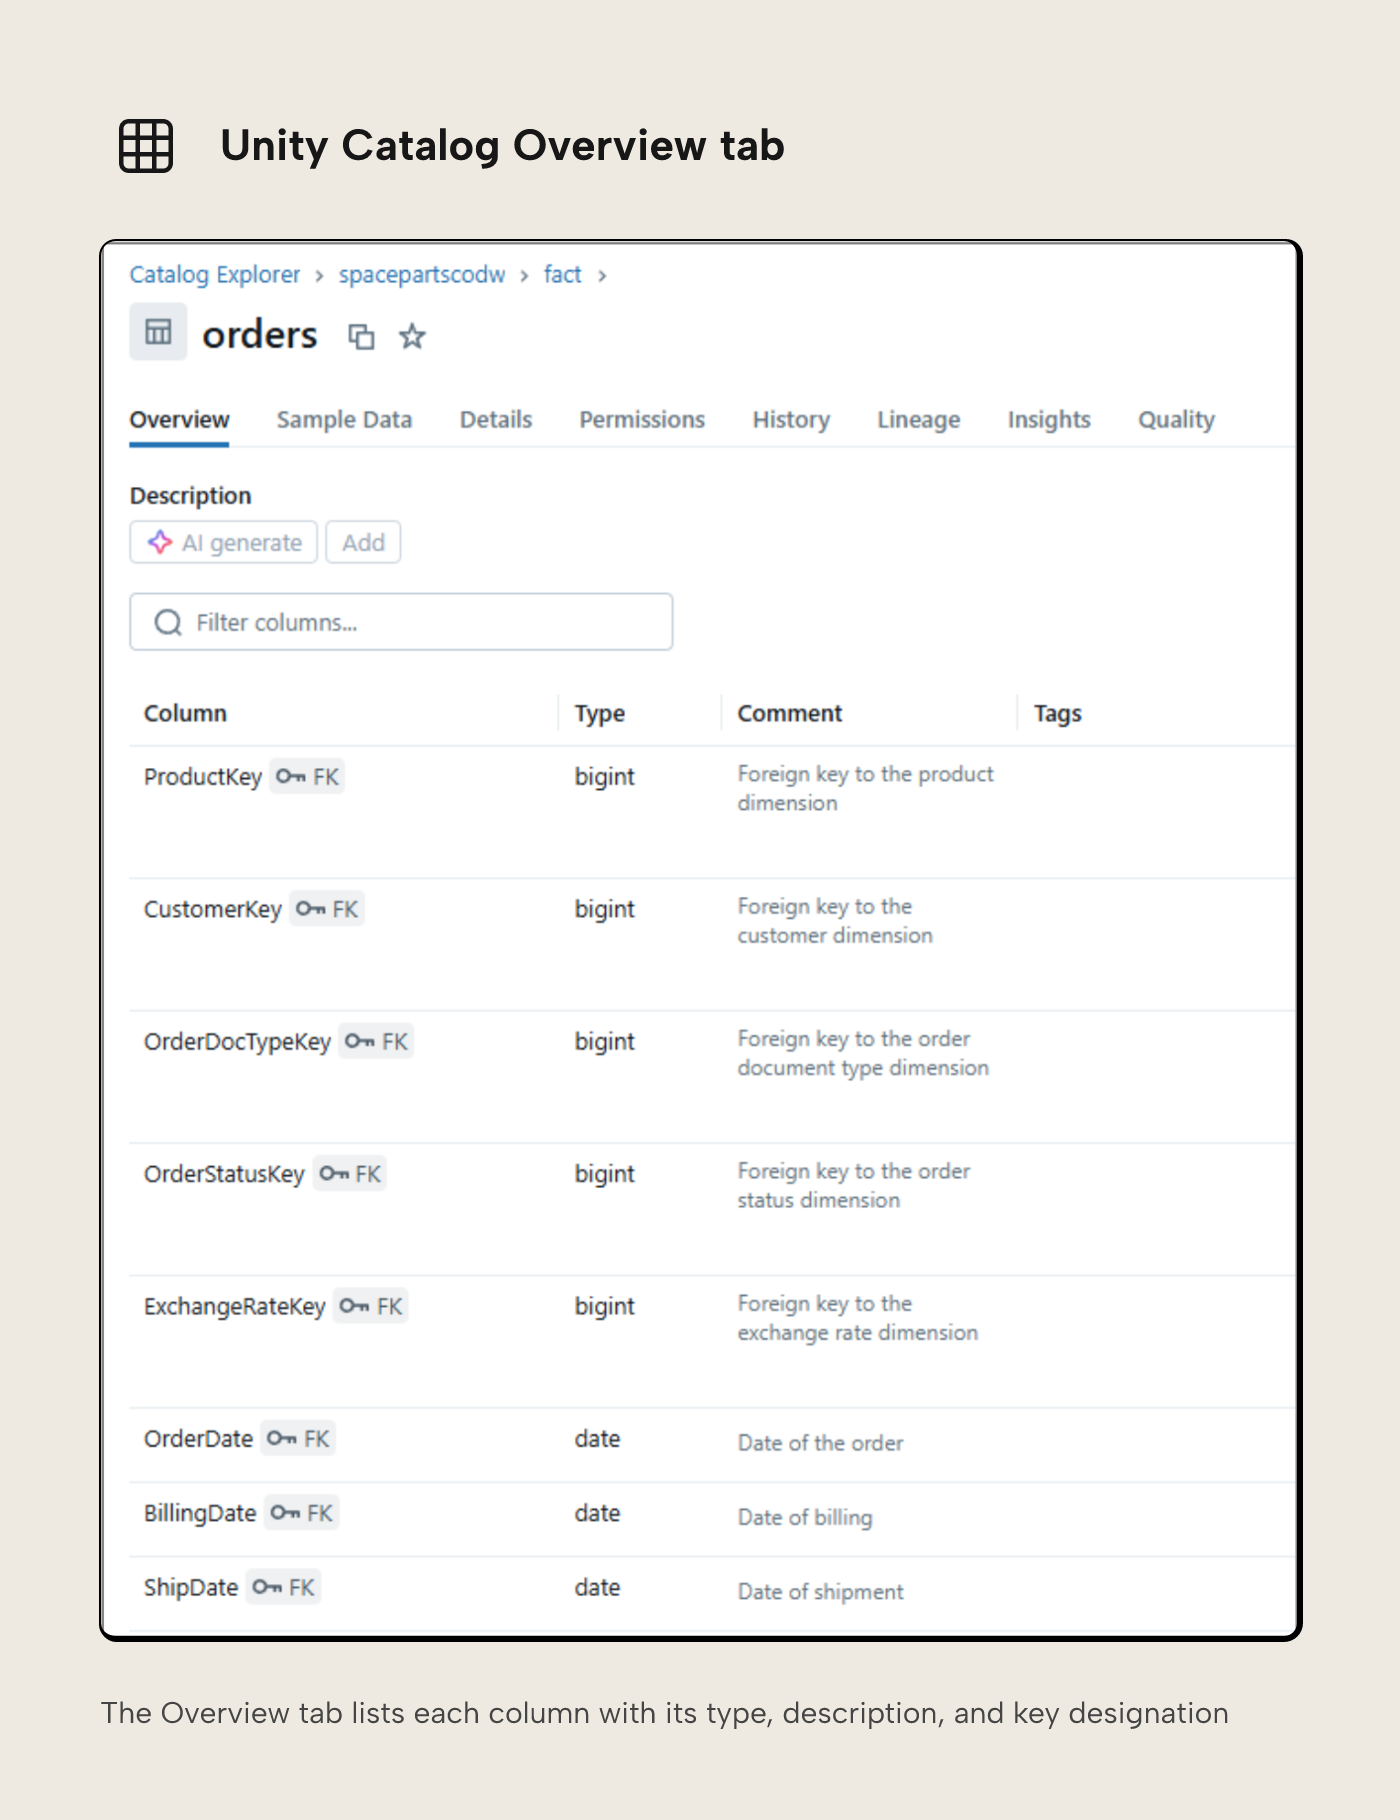
The Overview tab allows you to navigate through schemas and tables within the catalog and see descriptions.
At the table level, you’ll see a list of all available columns. Each column can also have a description, and you’ll also see whether columns have been designated as primary or foreign keys.
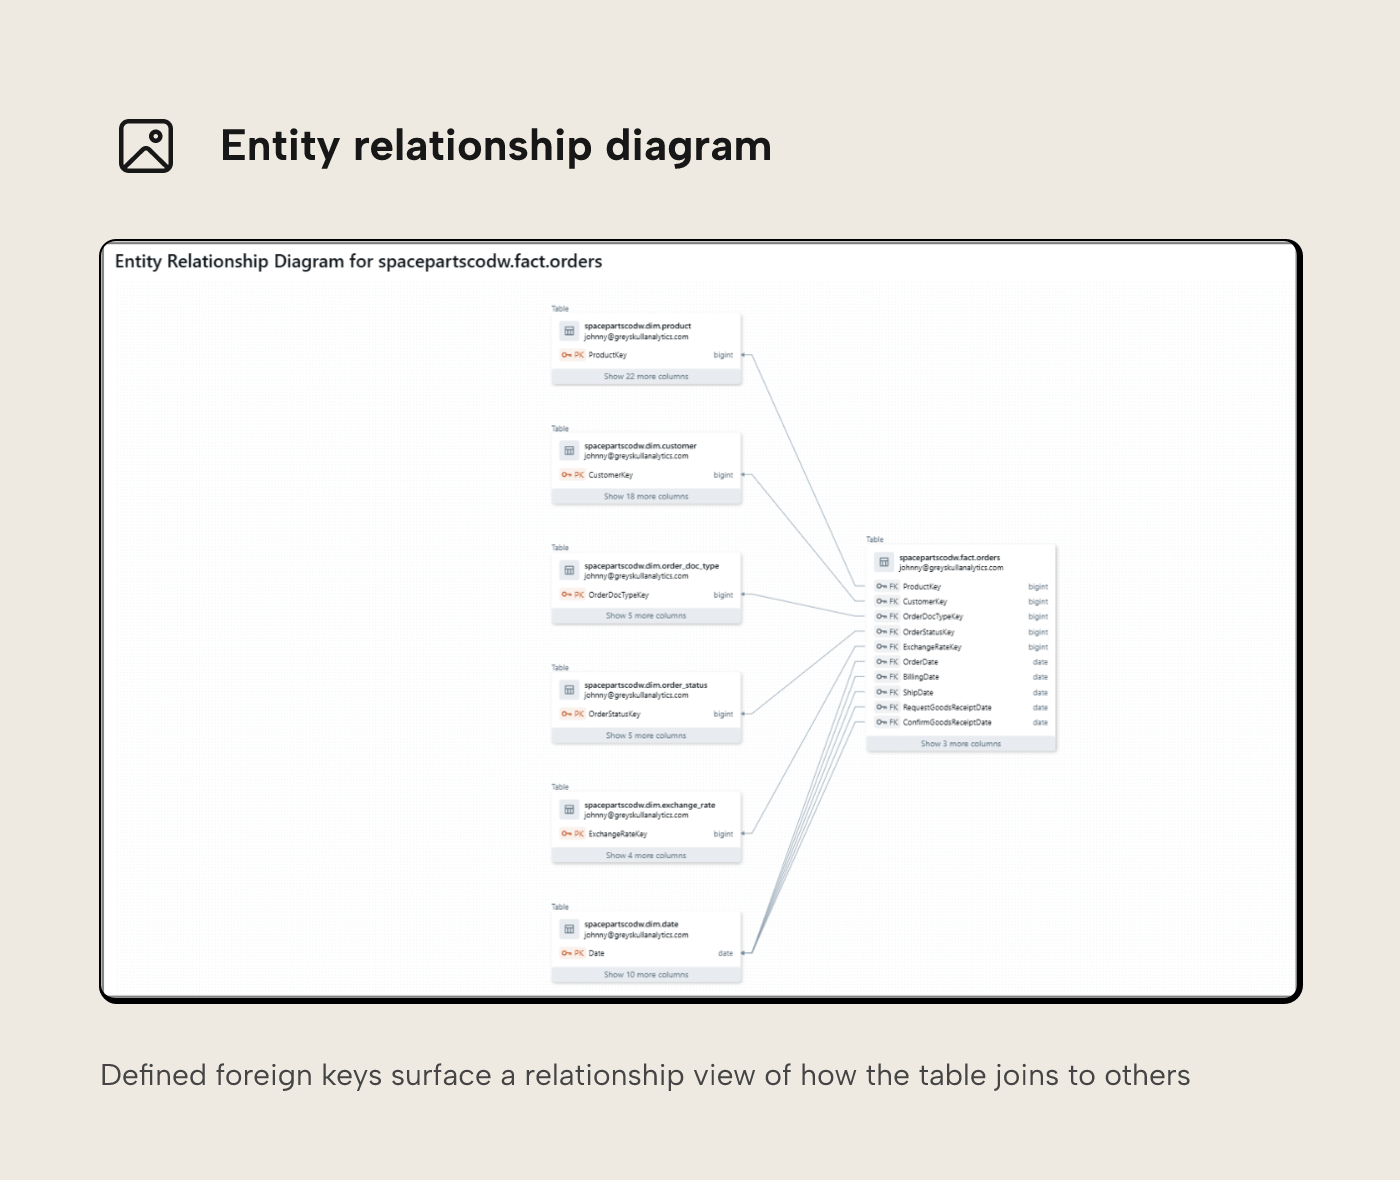
Where foreign keys have been defined, there’s a relationship view available, so you can see which other tables a given table relates to.
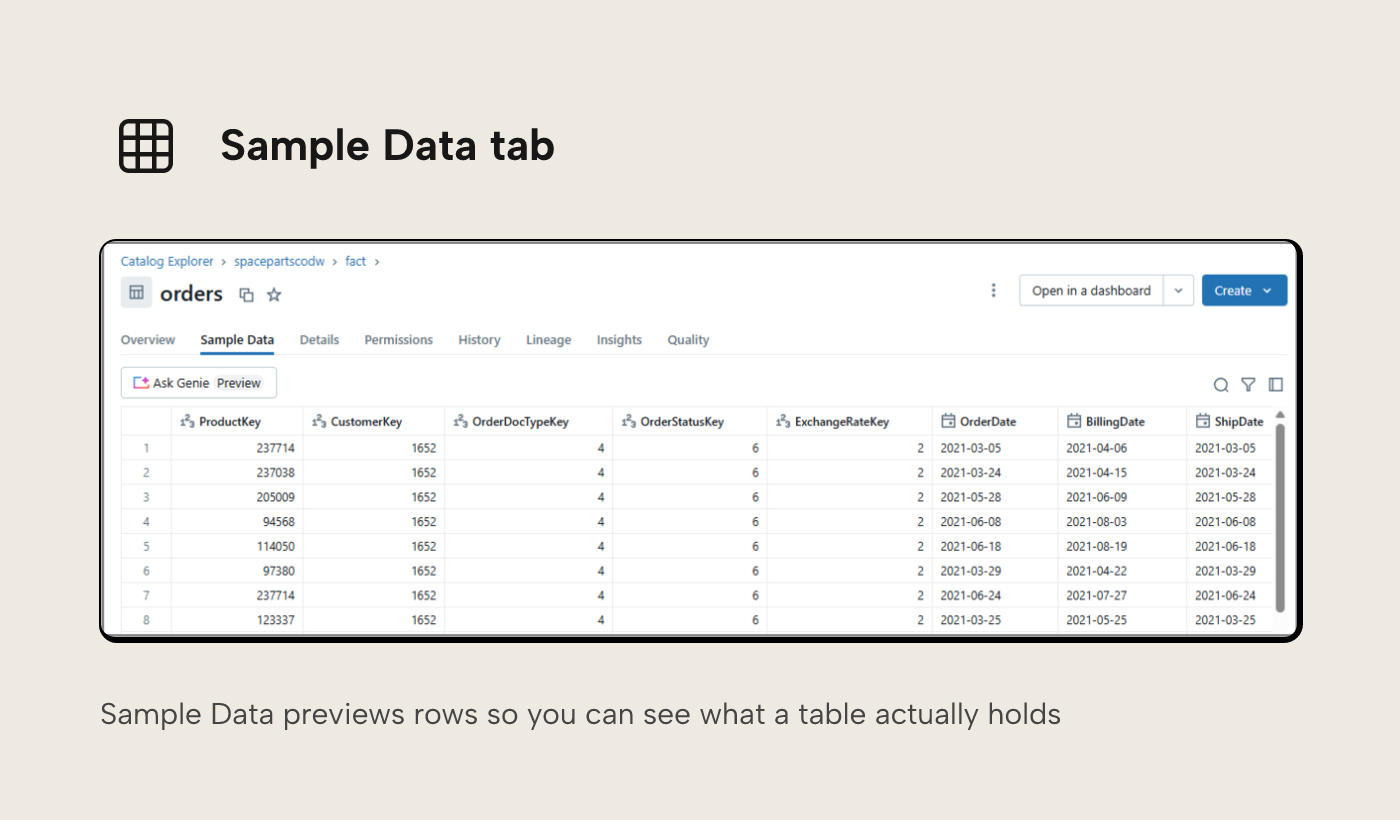
You need to be at the table level in order for the sample data and lineage tabs to appear. The sample data tab, somewhat predictably, shows sample rows from the table, and this is a great way to start familiarising yourself with what data is there. There’s even an option to use Genie AI to help you explore this data.
The permissions tab is where access is administered. You may find yourself in a position where you can see an object such as a table or schema in Databricks, but find yourself not able to view the data (via something like the sample data tab) or query it. This is called BROWSE access and is the default access assigned to users.
In order to actually return data you will need at least SELECT access. If you find yourself in this scenario, you’ll need somebody with MANAGE access on the object to assign you the relevant permissions
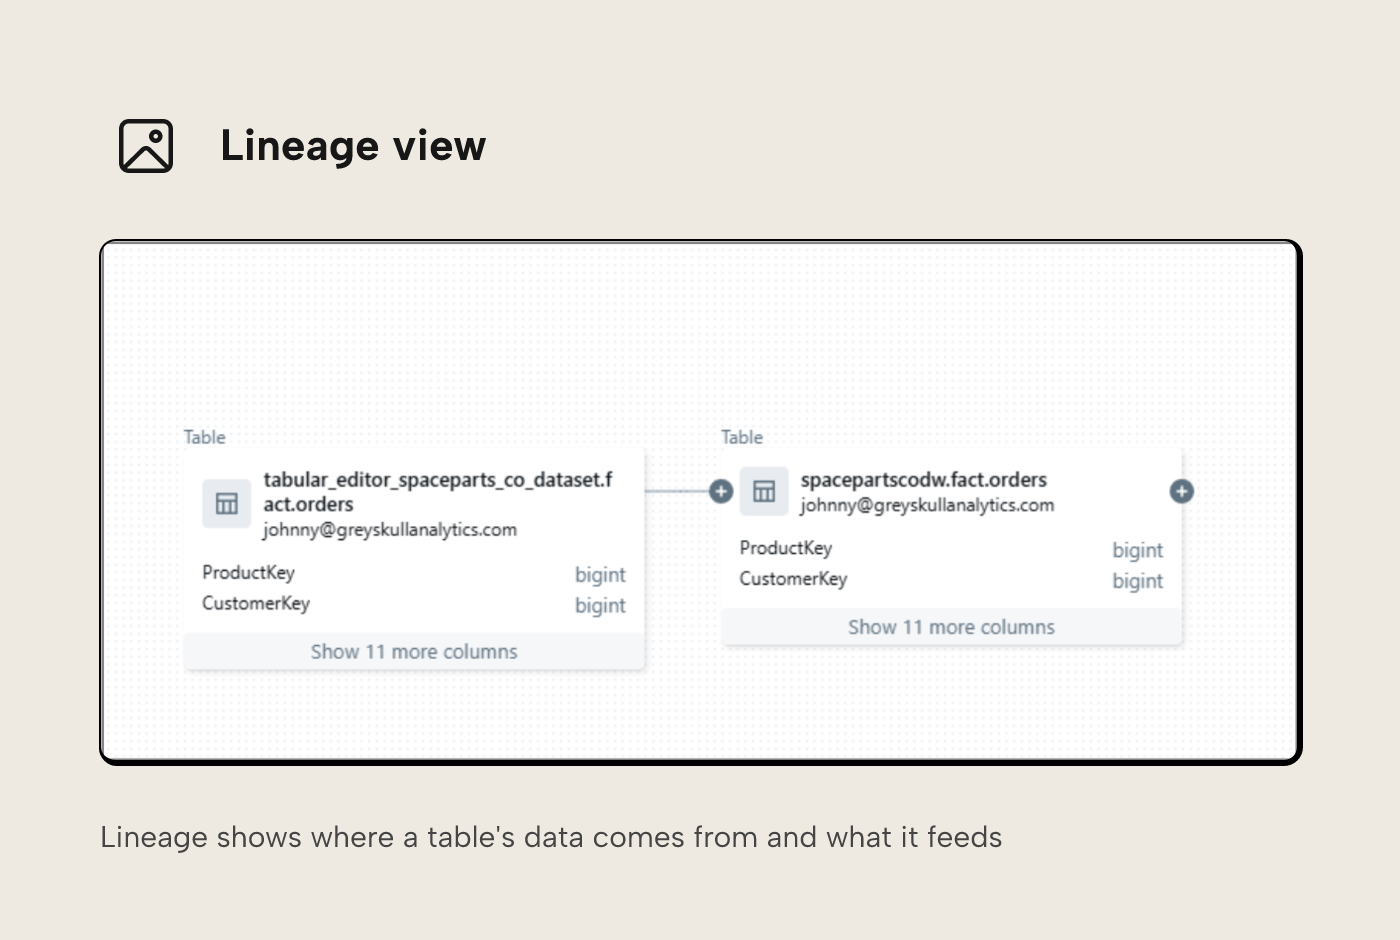
The lineage tab is a really useful tab for analysts and Power BI developers. This will show you the provenance of your data, indicating which tables in Databricks the table has been built from and potentially which tables it might contribute to building. Lineage can be viewed in a tabular format or in a useful lineage graph that helps you identify lineage graphically.
The final tab worthy of note is the Insights tab. This tab will show you the frequency with which a particular table is being queried, who has been querying it, what queries are being used, whether queries are being used in Databricks dashboards or notebooks and also which tables are frequently joined to a table.
Knowing which tables already see frequent use and how they’re being used can be a useful source of inspiration for any semantic models you may wish to build.
Databricks SQL
Databricks SQL is the umbrella term that refers to the collection of services in Databricks that bring data warehousing capabilities and performance to the data lakehouse. It includes services such as the SQL Warehouse compute engine and is also the home of AI/BI capabilities such as dashboards and Genie rooms.
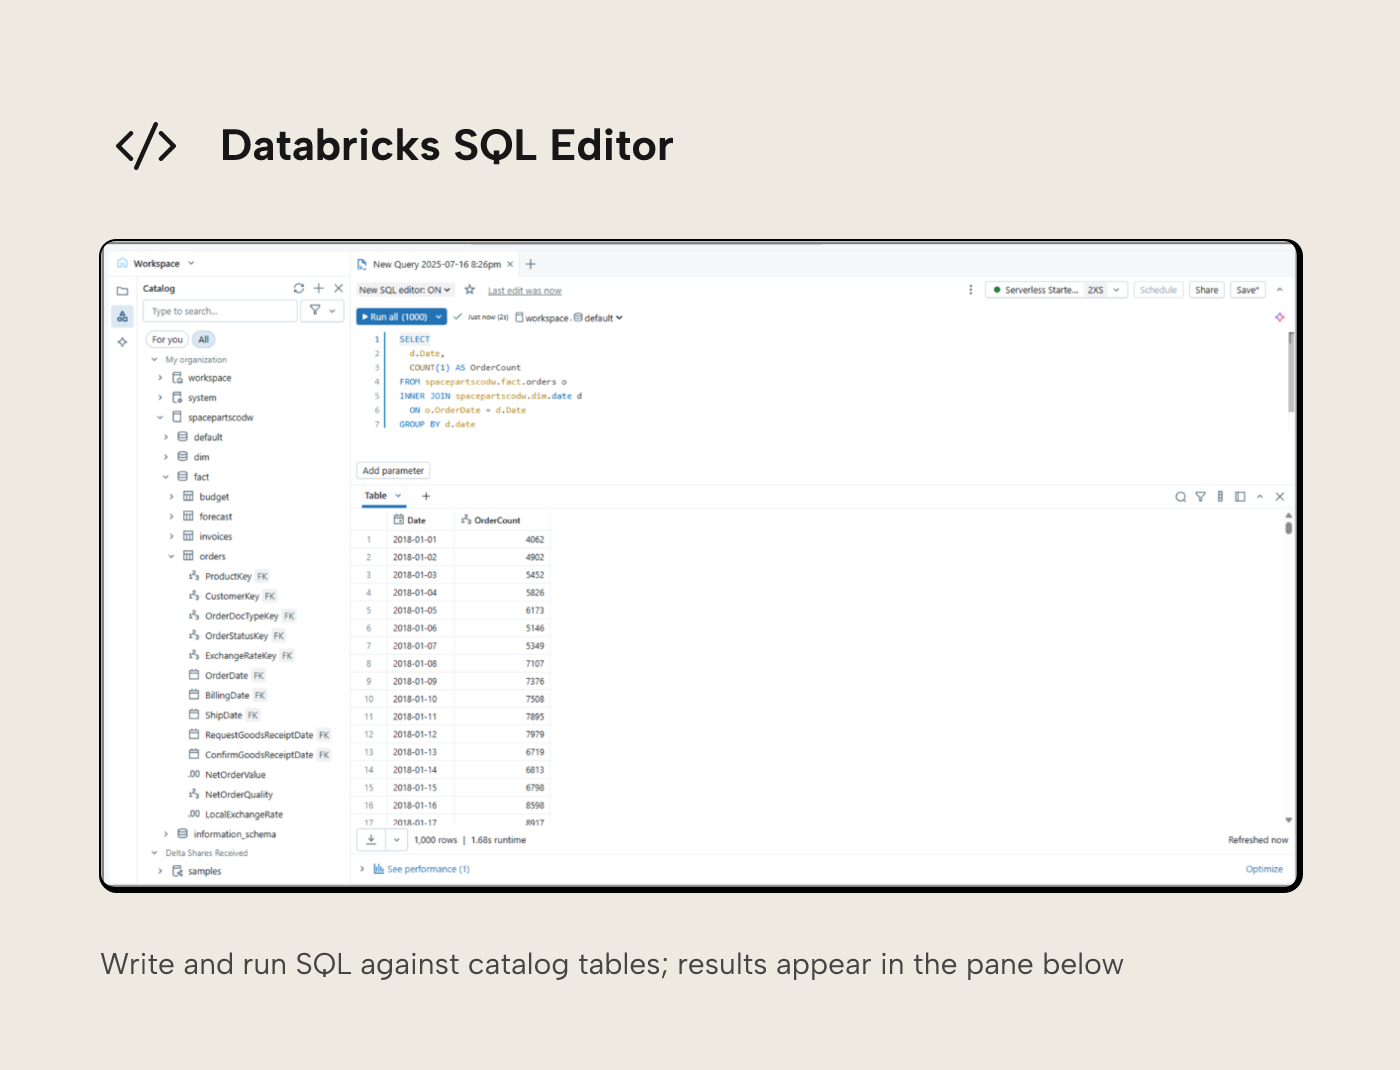
Our area of focus for data discovery though, is the SQL Editor. The SQL Editor UI may seem familiar. Its layout and functionality is very similar to client tools such as SQL Server Management Studio (SSMS) or Azure Data Studio. On the left side you can navigate through available catalogs, schemas and tables, allowing you to navigate right down to the available columns for each table.
The query pane allows you to write SQL queries against available tables. Right clicking on a table can generate a SELECT * statement for the top 1000 records in a new tab. You can hand type SQL queries in the query pane or you can drag and drop columns and tables from the Catalog explorer pane onto the query pane in order to construct your query. You can even use the AI assistant to author queries on your behalf using natural language.
When you run queries, results are displayed in the results pane at the bottom of the page.
Be wary of the SQL syntax you need to use. ANSI compliant SQL will work fine, but you may find functions you’re used to using in other SQL dialects may not be supported here, whilst there are also countless Databricks SQL specific functions you can now take advantage of. A guide to Databricks SQL functions is available here.
Using the SQL Editor can be a great way to familiarise yourself with data available to you and explore how it behaves when joined to other tables and how it can be aggregated. It’s a great tool for testing and validating against your semantic models too.
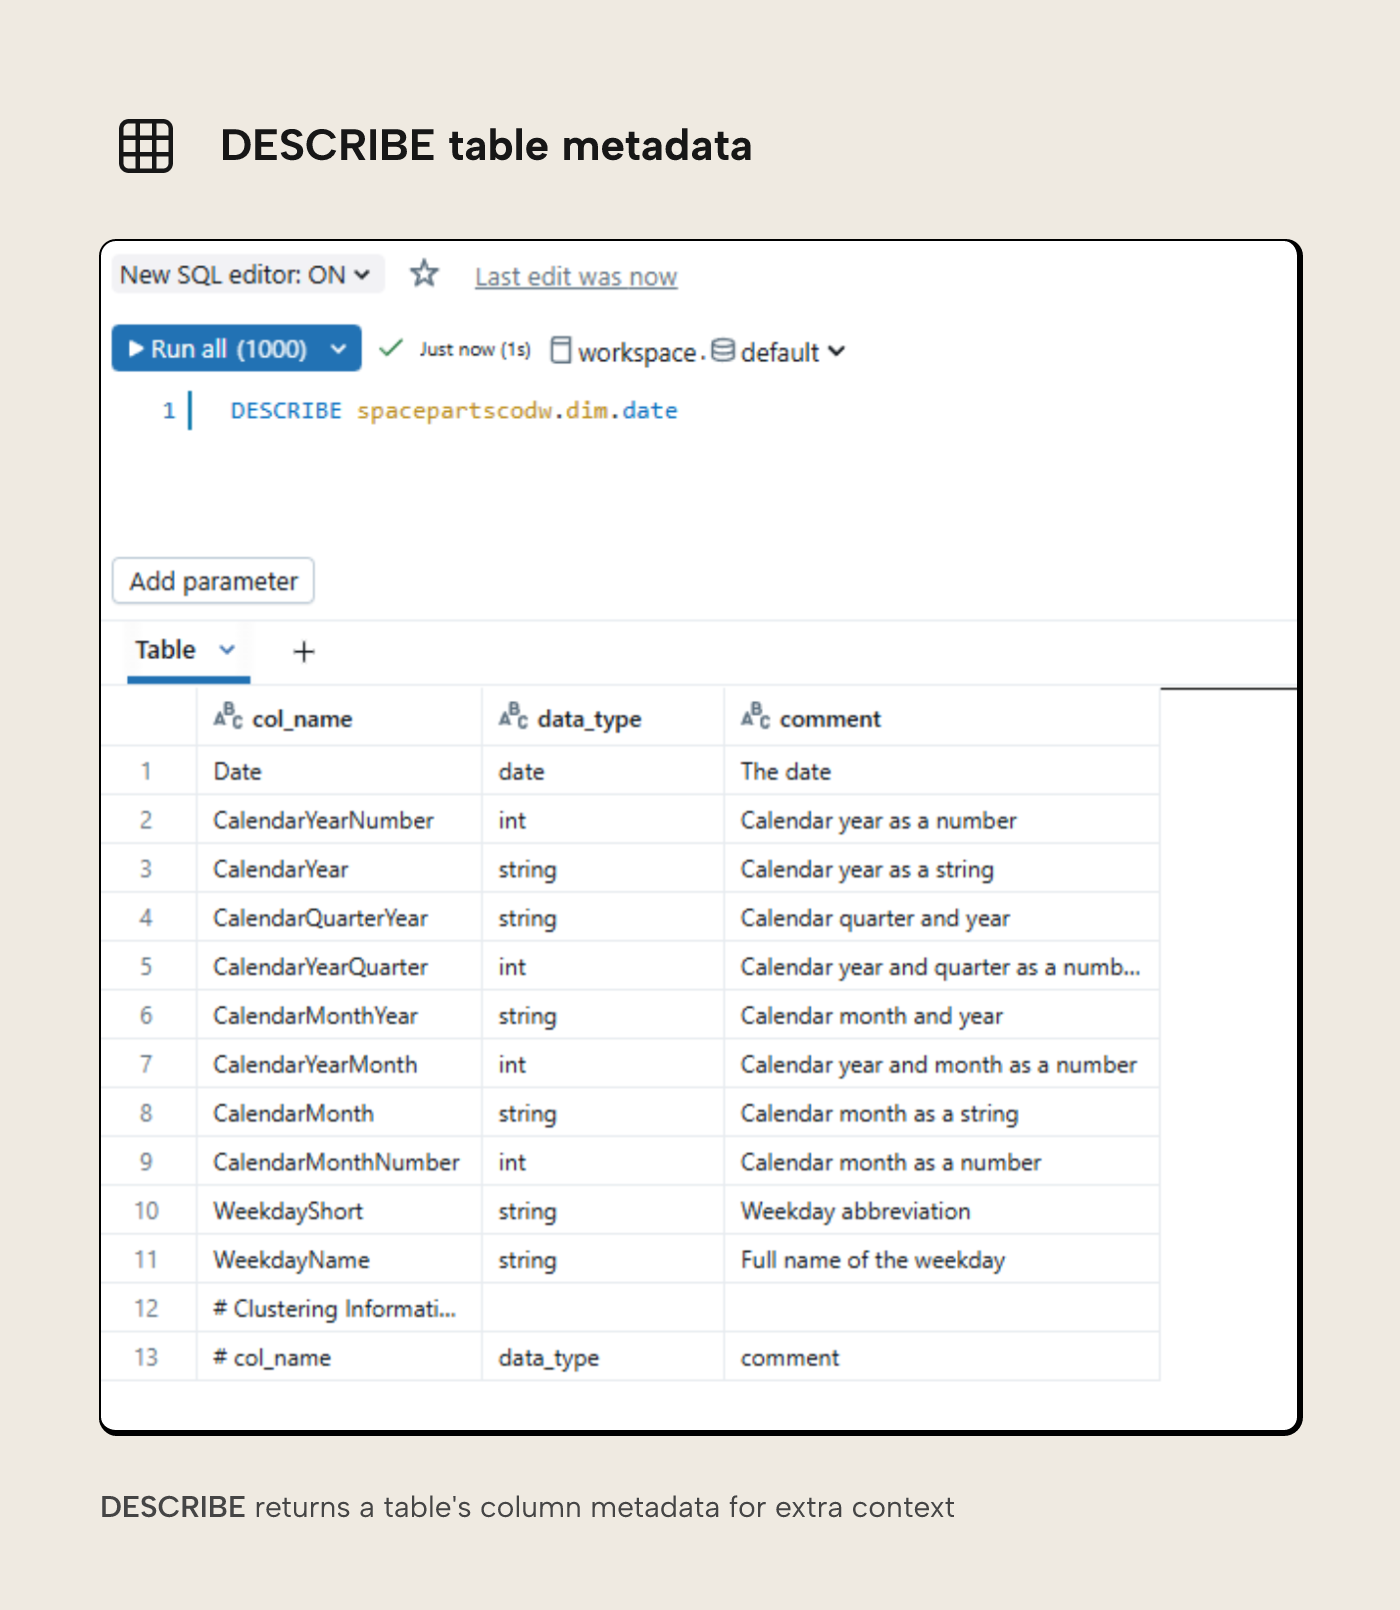
One final tip for exploring your data using the SQL Editor is to use the DESCRIBE command.
This command returns metadata catalog information related to any given table, providing you further context.
Ready to go?
So Borp now has the right tools at their disposal to understand and validate the data they will be using to build their first semantic model using Tabular Editor and Databricks. They’re confident of which tables they can bring in to their model to satisfy their users' requirements, how those tables are related, and they even have a plan for how they can test and reconcile the model once it’s built.
So they’re good to go, right?
Nearly. Borp still needs to configure the Databricks SQL Warehouse for their requirements, and there are a few software prerequisites before Tabular Editor can connect to Databricks.
Those prerequisites are the next step before opening Tabular Editor.
For further reading
- What is Databricks? A guide for Power BI developers (Tabular Editor). Covers what Databricks is, how lakehouses differ from data warehouses, and why the platform feels familiar once you know where to look.
- How to configure a Databricks SQL warehouse for Power BI (Tabular Editor). Covers SQL Warehouse configuration, cluster sizing, ODBC driver setup, and the connection details Borp needs before opening Tabular Editor.
- What is Unity Catalog? (Microsoft Learn). Reference for the metadata catalog Borp uses in this article: permissions, data discovery, lineage, and how catalogs, schemas, and tables are related.
- What are catalogs in Azure Databricks? (Microsoft Learn). Explains the three-level namespace (
catalog.schema.table) visible in the Unity Catalog UI and SQL Editor walkthroughs.
In conclusion
With Unity Catalog and Databricks SQL, Borp now has the tools to understand and validate the data behind their first semantic model: which tables to bring in, how they relate, and how to test the result. There are still a few prerequisites to sort out, like configuring the SQL Warehouse and installing the software needed to connect Tabular Editor. The next article is part 4, How to configure a Databricks SQL warehouse for Power BI, which covers those connection prerequisites in detail.
Explore Databricks data, then bring the right tables into Tabular Editor 3.
Give Tabular Editor a spin