Key takeaways
- Tables are easy but rarely deliberate: A default matrix gives detailed numbers but leaves readers to interpret everything; deliberate choices about what to show and emphasize make the difference.
- The hard part is the choices: Deciding what matters, highlighting it, removing noise, sorting with intent, and adding context aren't technically difficult, but each is a judgment call tied to the reader's question.
- AI helps implement, not decide: AI agents can speed up report creation, but they still need someone to define what matters, for whom, and why.
Tables: the most popular visuals of all time
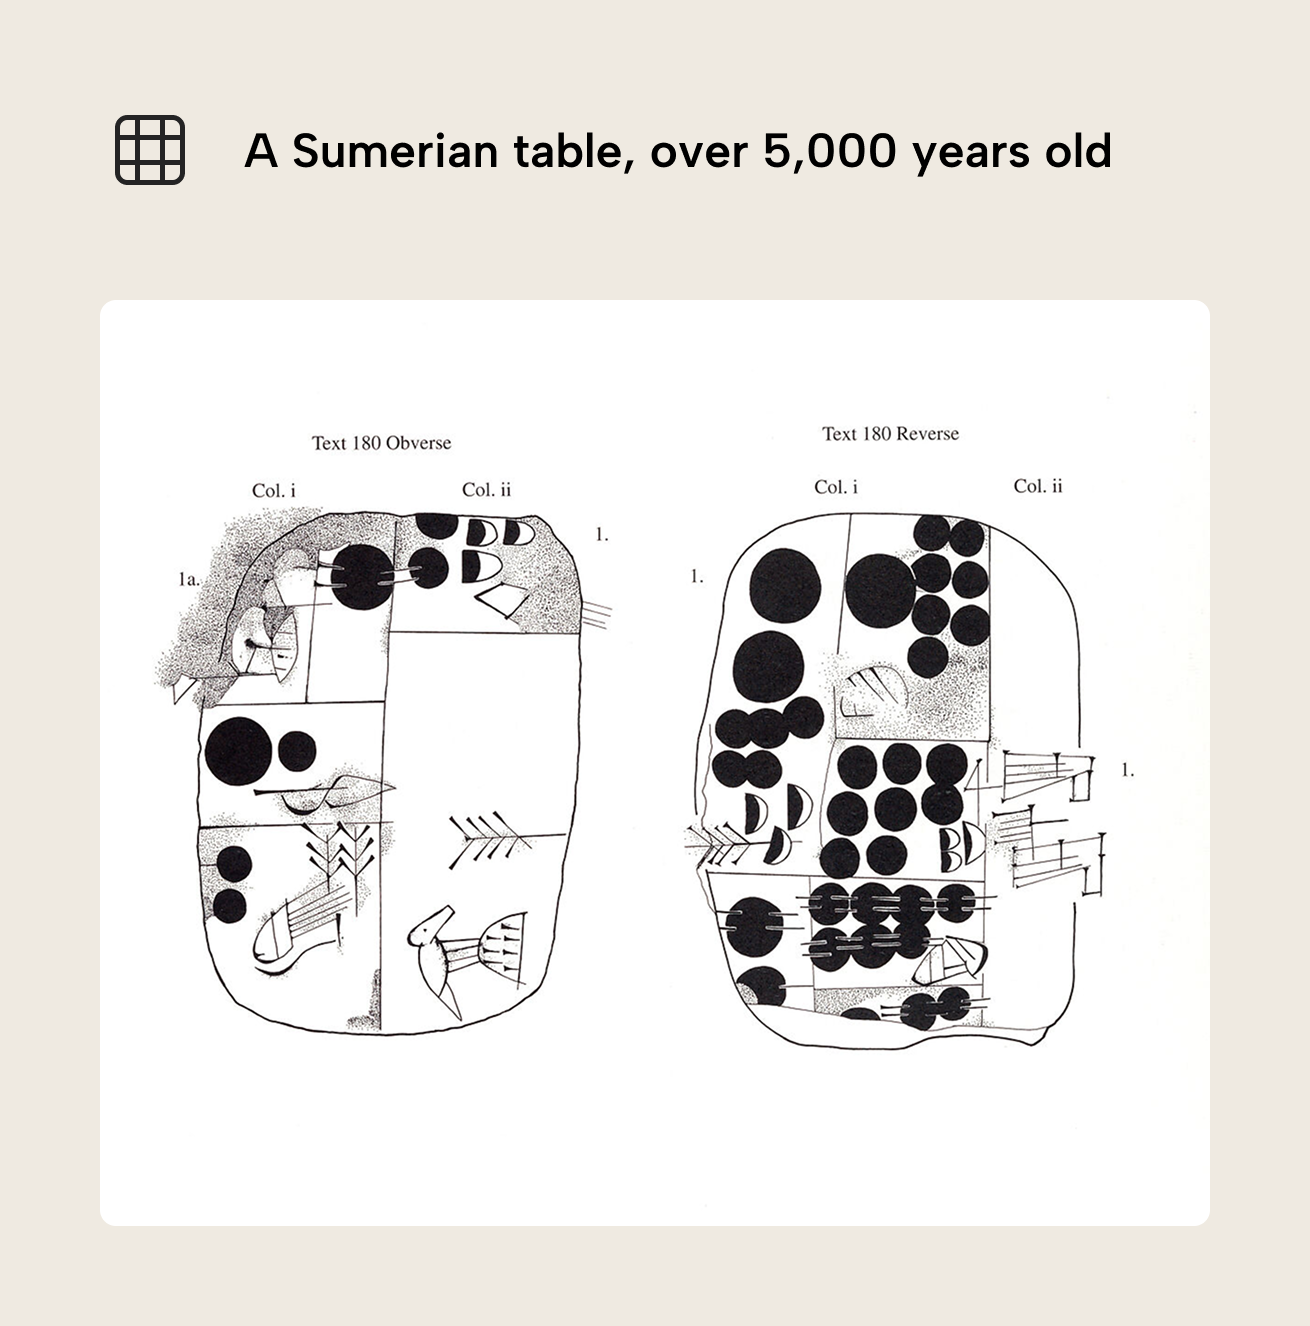
To understand our attachment to the table, let’s first take a very brief detour to ±3100 BCE. In ancient Mesopotamia, scribes divided wet clay into cases and columns to track deliveries and distributions of barley and wheat, with pictographs identifying the product and circles to record quantity. It’s arguably one of the earliest recorded uses of a table, and it illustrates our tight bond: we go way back.
In the year 2026 CE, Power BI reports make tables and matrixes easy to create. You just drop one onto the report canvas and add some fields – and ta-da, you have a grid of numbers. “Easy to create” and “easy to read” are different things, however. A table that works for the reader requires deliberate choices about what to show, how to format it, and what to emphasize - choices that are subjective, because they depend on who’s reading and what question they’re trying to answer.
Why you should design and build better tables
The human brain hasn’t evolved to process large heaps of information simultaneously; it needs to put in effort and is prone to error. It is, however, pretty good at visual perception. We can display information in ways that play into the strengths of the human brain (e.g. rapid and effortless pattern recognition) and minimize reliance on its weaknesses (e.g. short working memory and poor attention span). That’s what data viz is all about.
To illustrate, let’s take a look at how humans read tables.
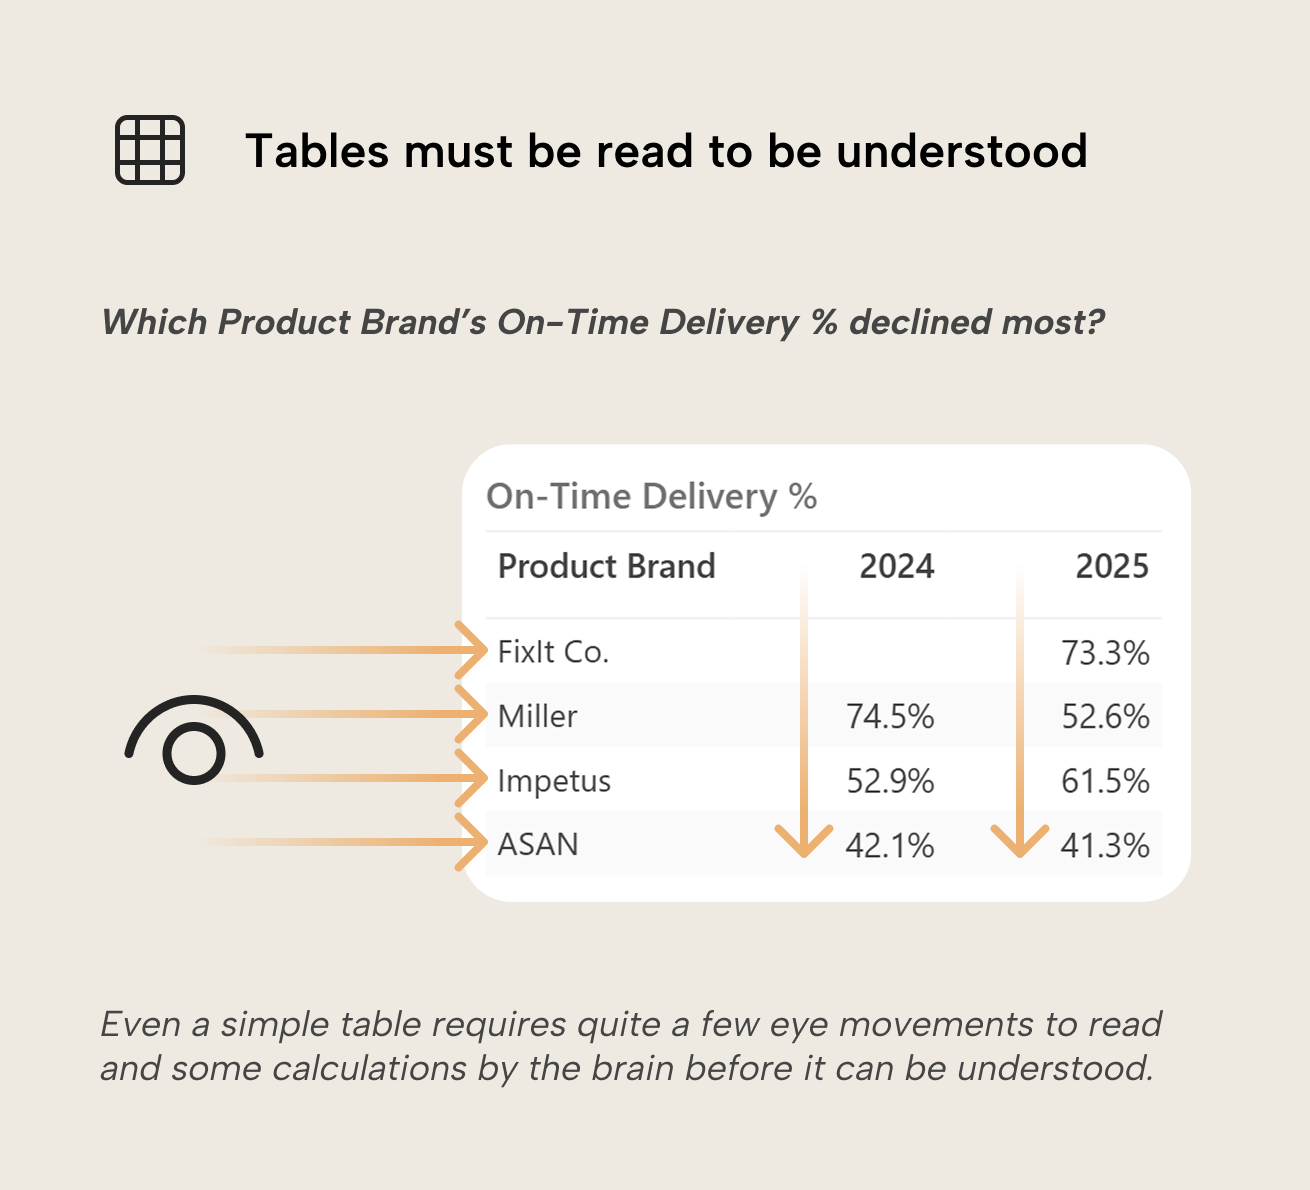
Furrowing a critical brow with a caveman grunt of “table bad!” is not helpful. Visual charts leverage what humans are built for: spotting trends and deviations at a glance. But tables aren’t going anywhere – they’re the right choice when readers need precise values, comparisons across many dimensions, or the ability to look up specific rows. Tables have their place but they have to work for the reader.
These principles are well-established, yet unformatted tables are still found in many dashboards. Applying the principles takes critical thinking and deliberate effort, which are tempting to skip when the deadline is in a few hours and stakeholders “just want the numbers”. It’s a fair shortcut in the moment, but one that snowballs: one unformatted table becomes three, ten, ... Before long the organization’s reporting culture defaults to raw data dumps that no one reads carefully. Let’s look at what that effort actually involves, because even AI tools that can generate charts from prompts shouldn’t skip it.
Going from Power BI defaults to deliberate choices
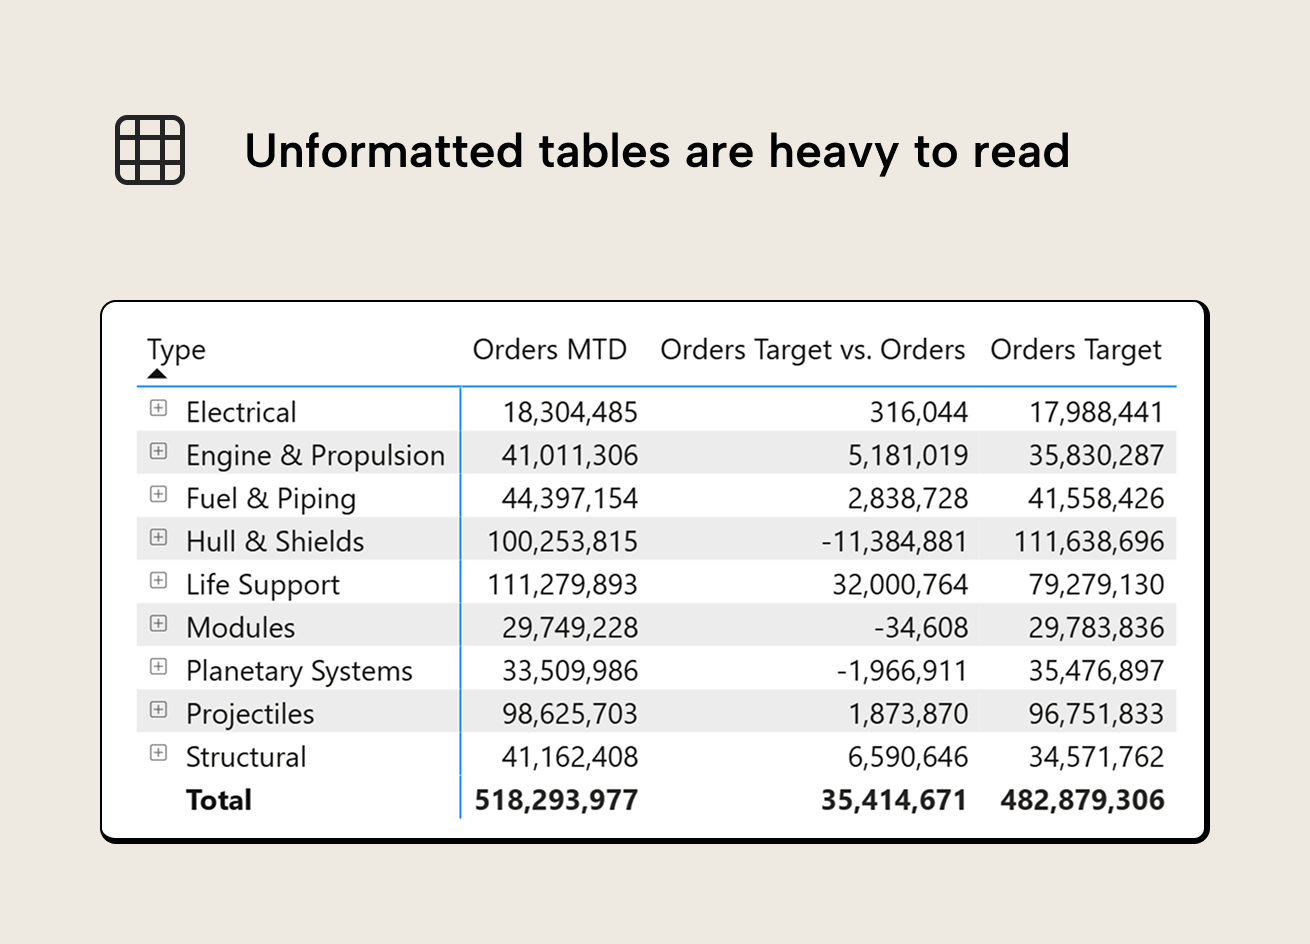
Suppose you have a product table with performance against targets. Out of the box, the Power BI matrix visual gives you a grid of numbers with alternating row shading and some nice blue accent bars. It's accurate, but it asks the reader to figure it out.
A few deliberate changes can make the table work for the reader:
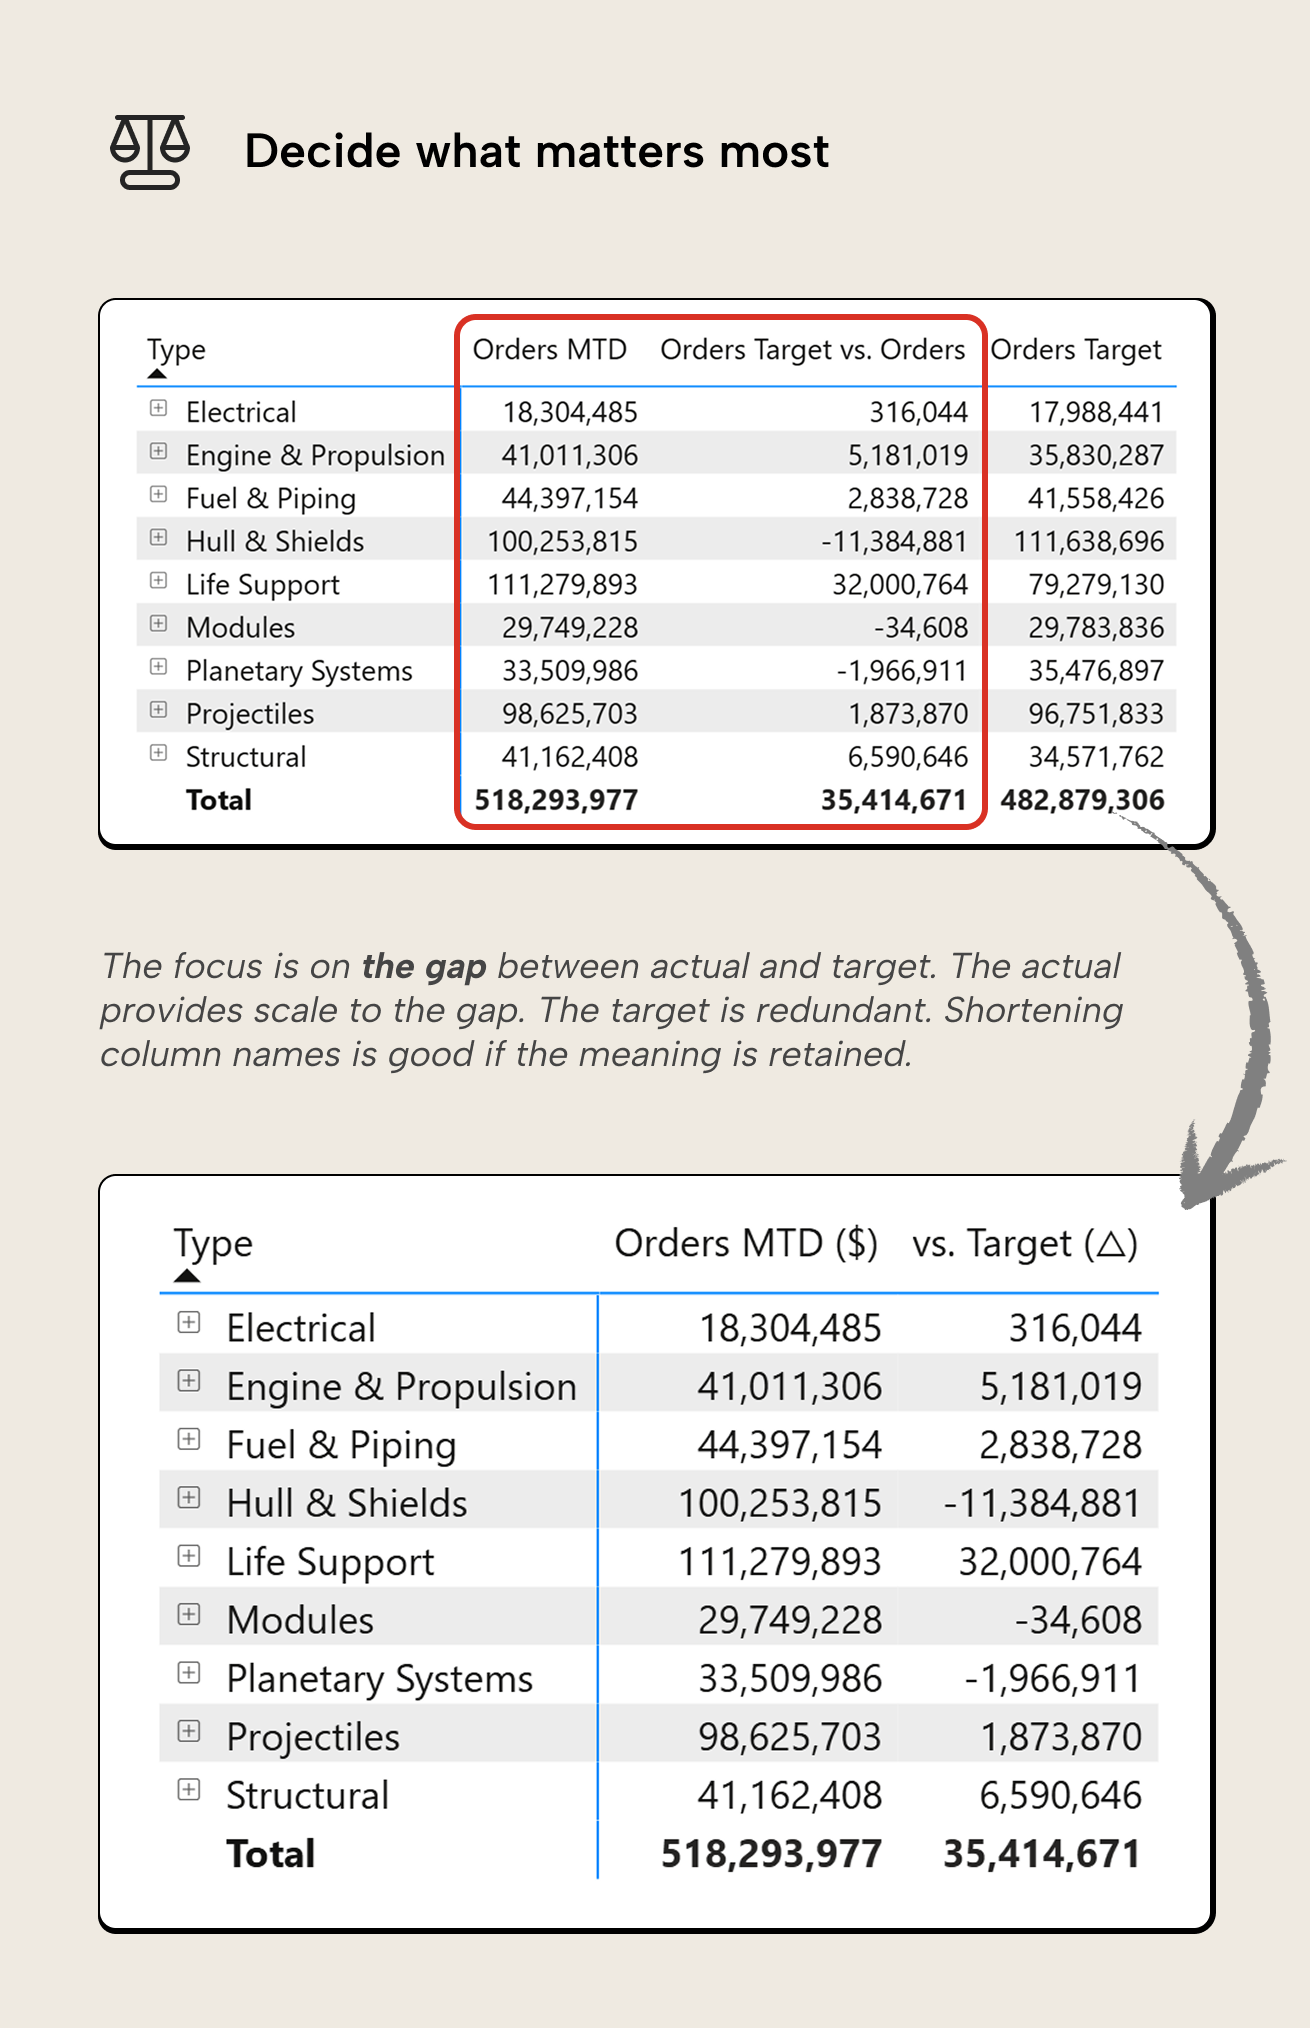
- Decide what matters most. Not every number in the table deserves equal attention. If the reader’s first question is "which product types are behind target?", then the gap between order value and target is the signal, everything else is context. That decision comes before any formatting. Keep only the metric and the gap.
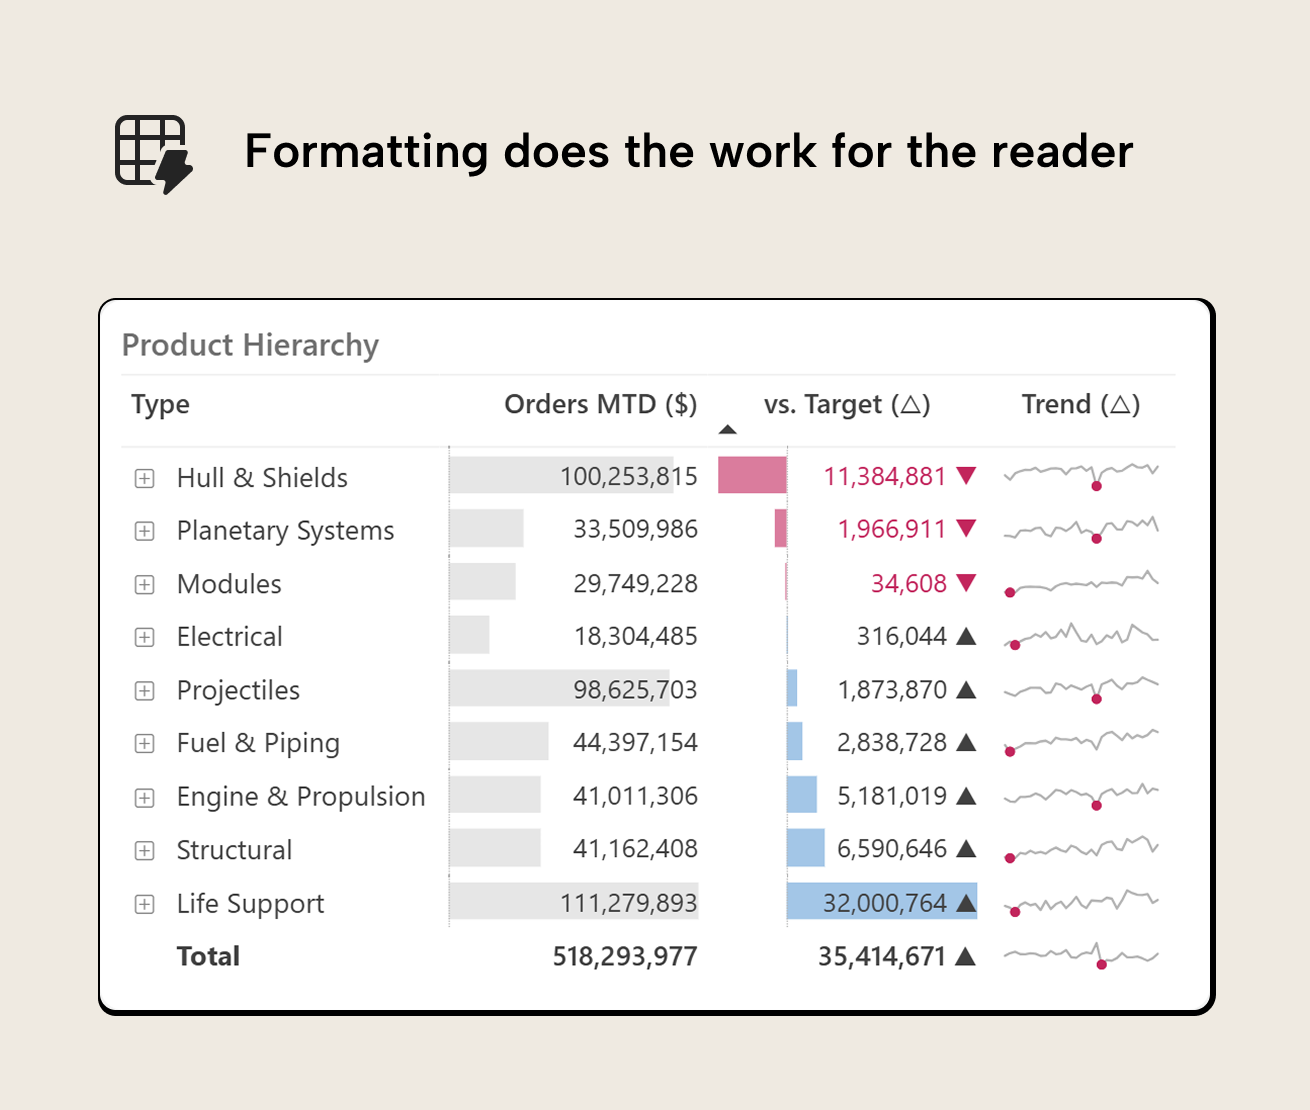
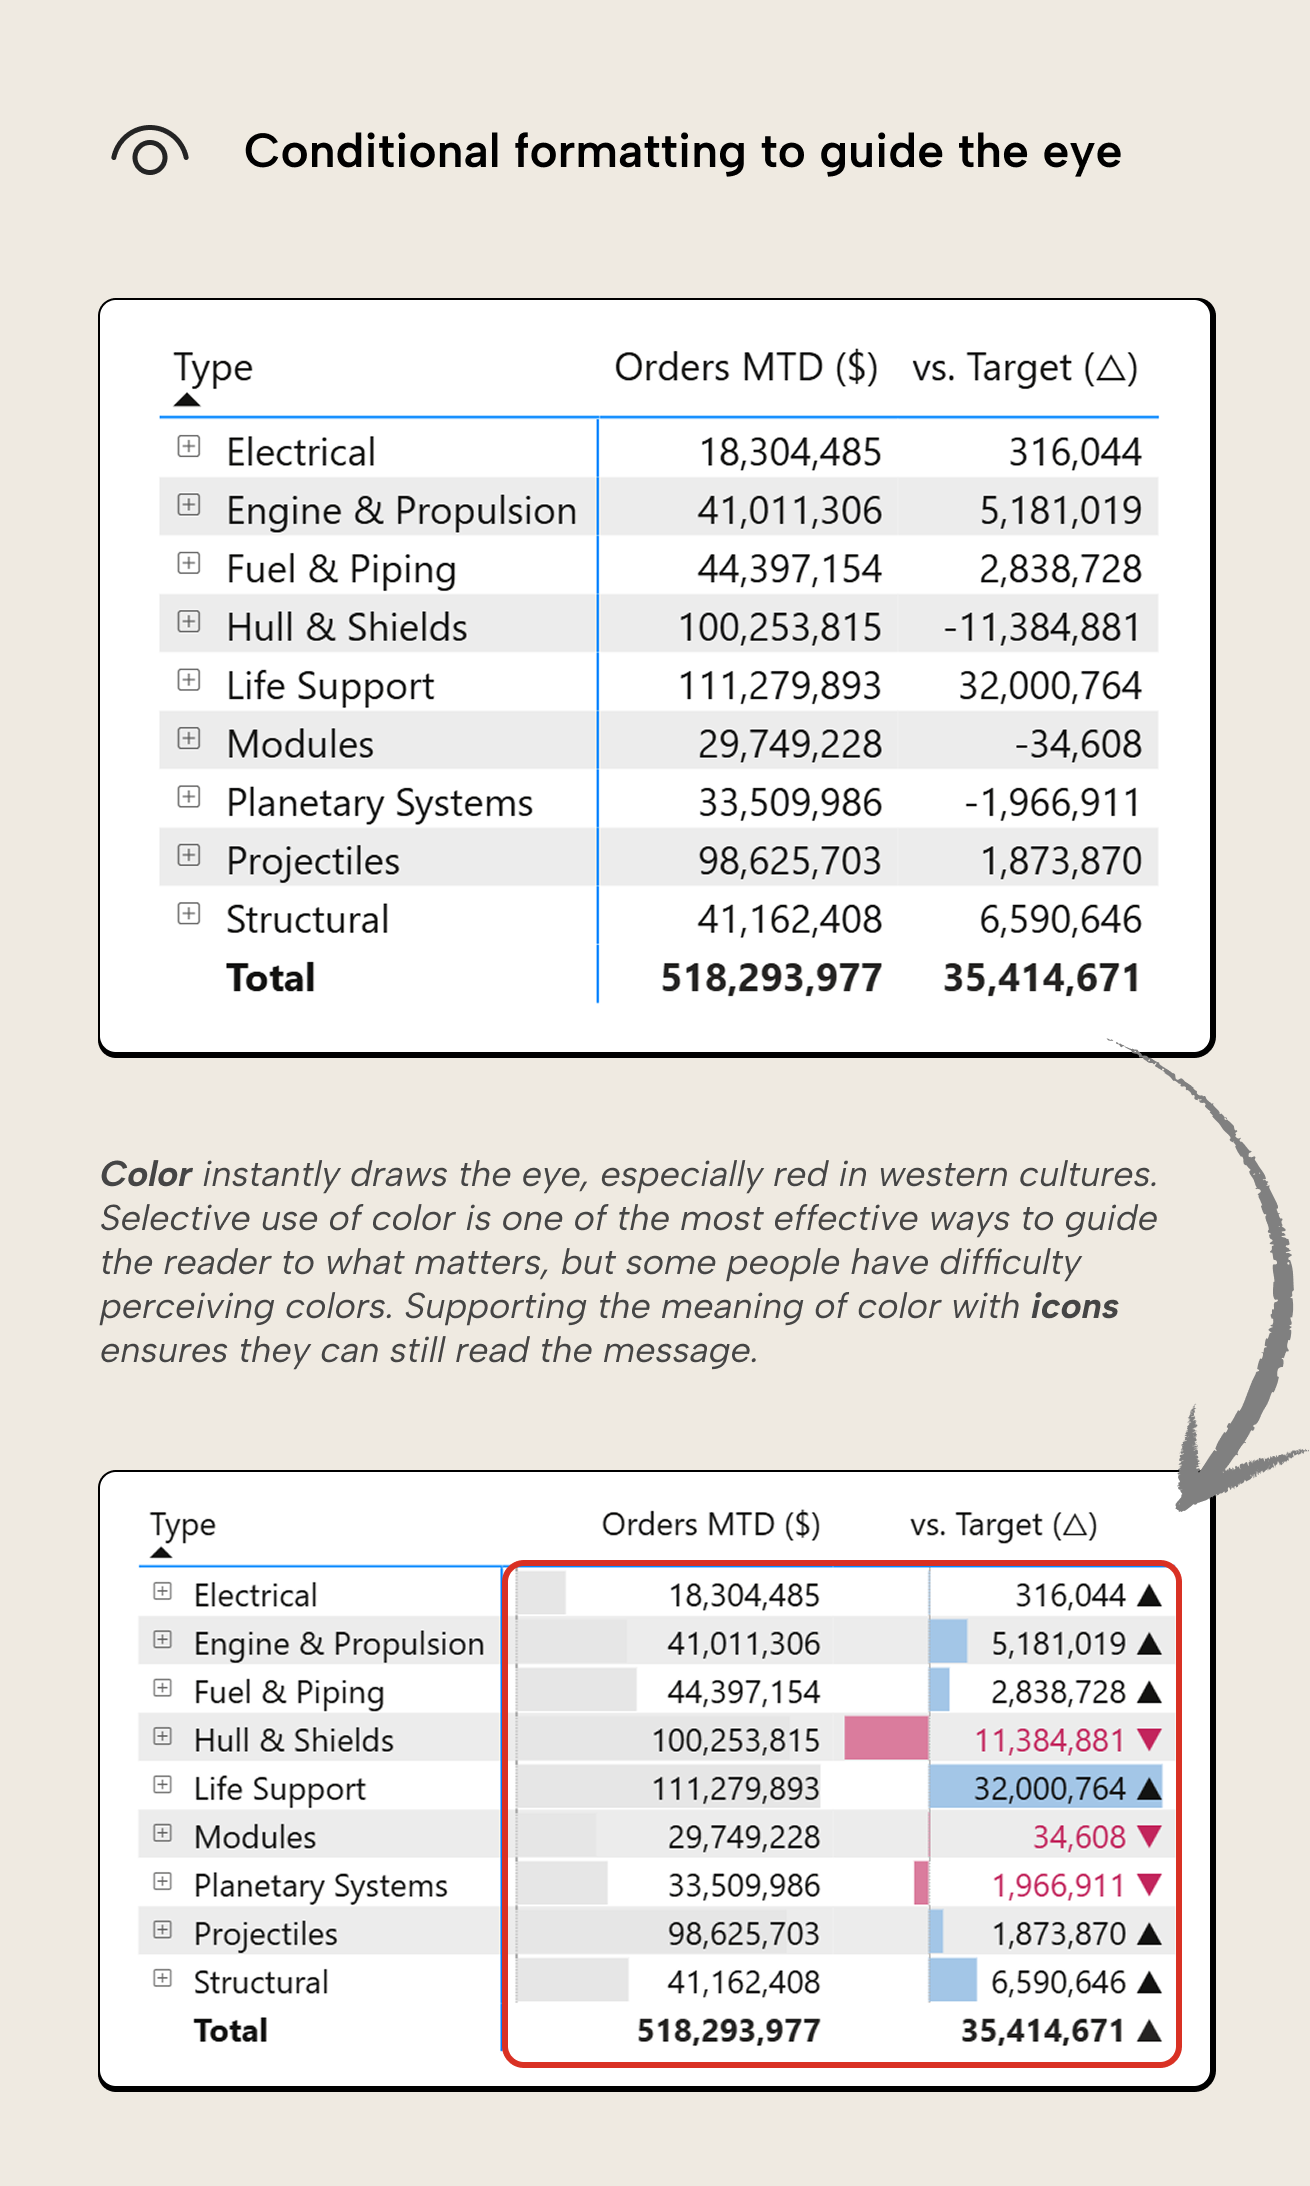
- Use conditional formatting to guide the eye. There should be a signal to highlight. Include data bars on important metrics and a color scale on the variance column to let the reader spot trouble without scanning every cell. We’re offloading work from short-term memory to visual perception; a much better trade.
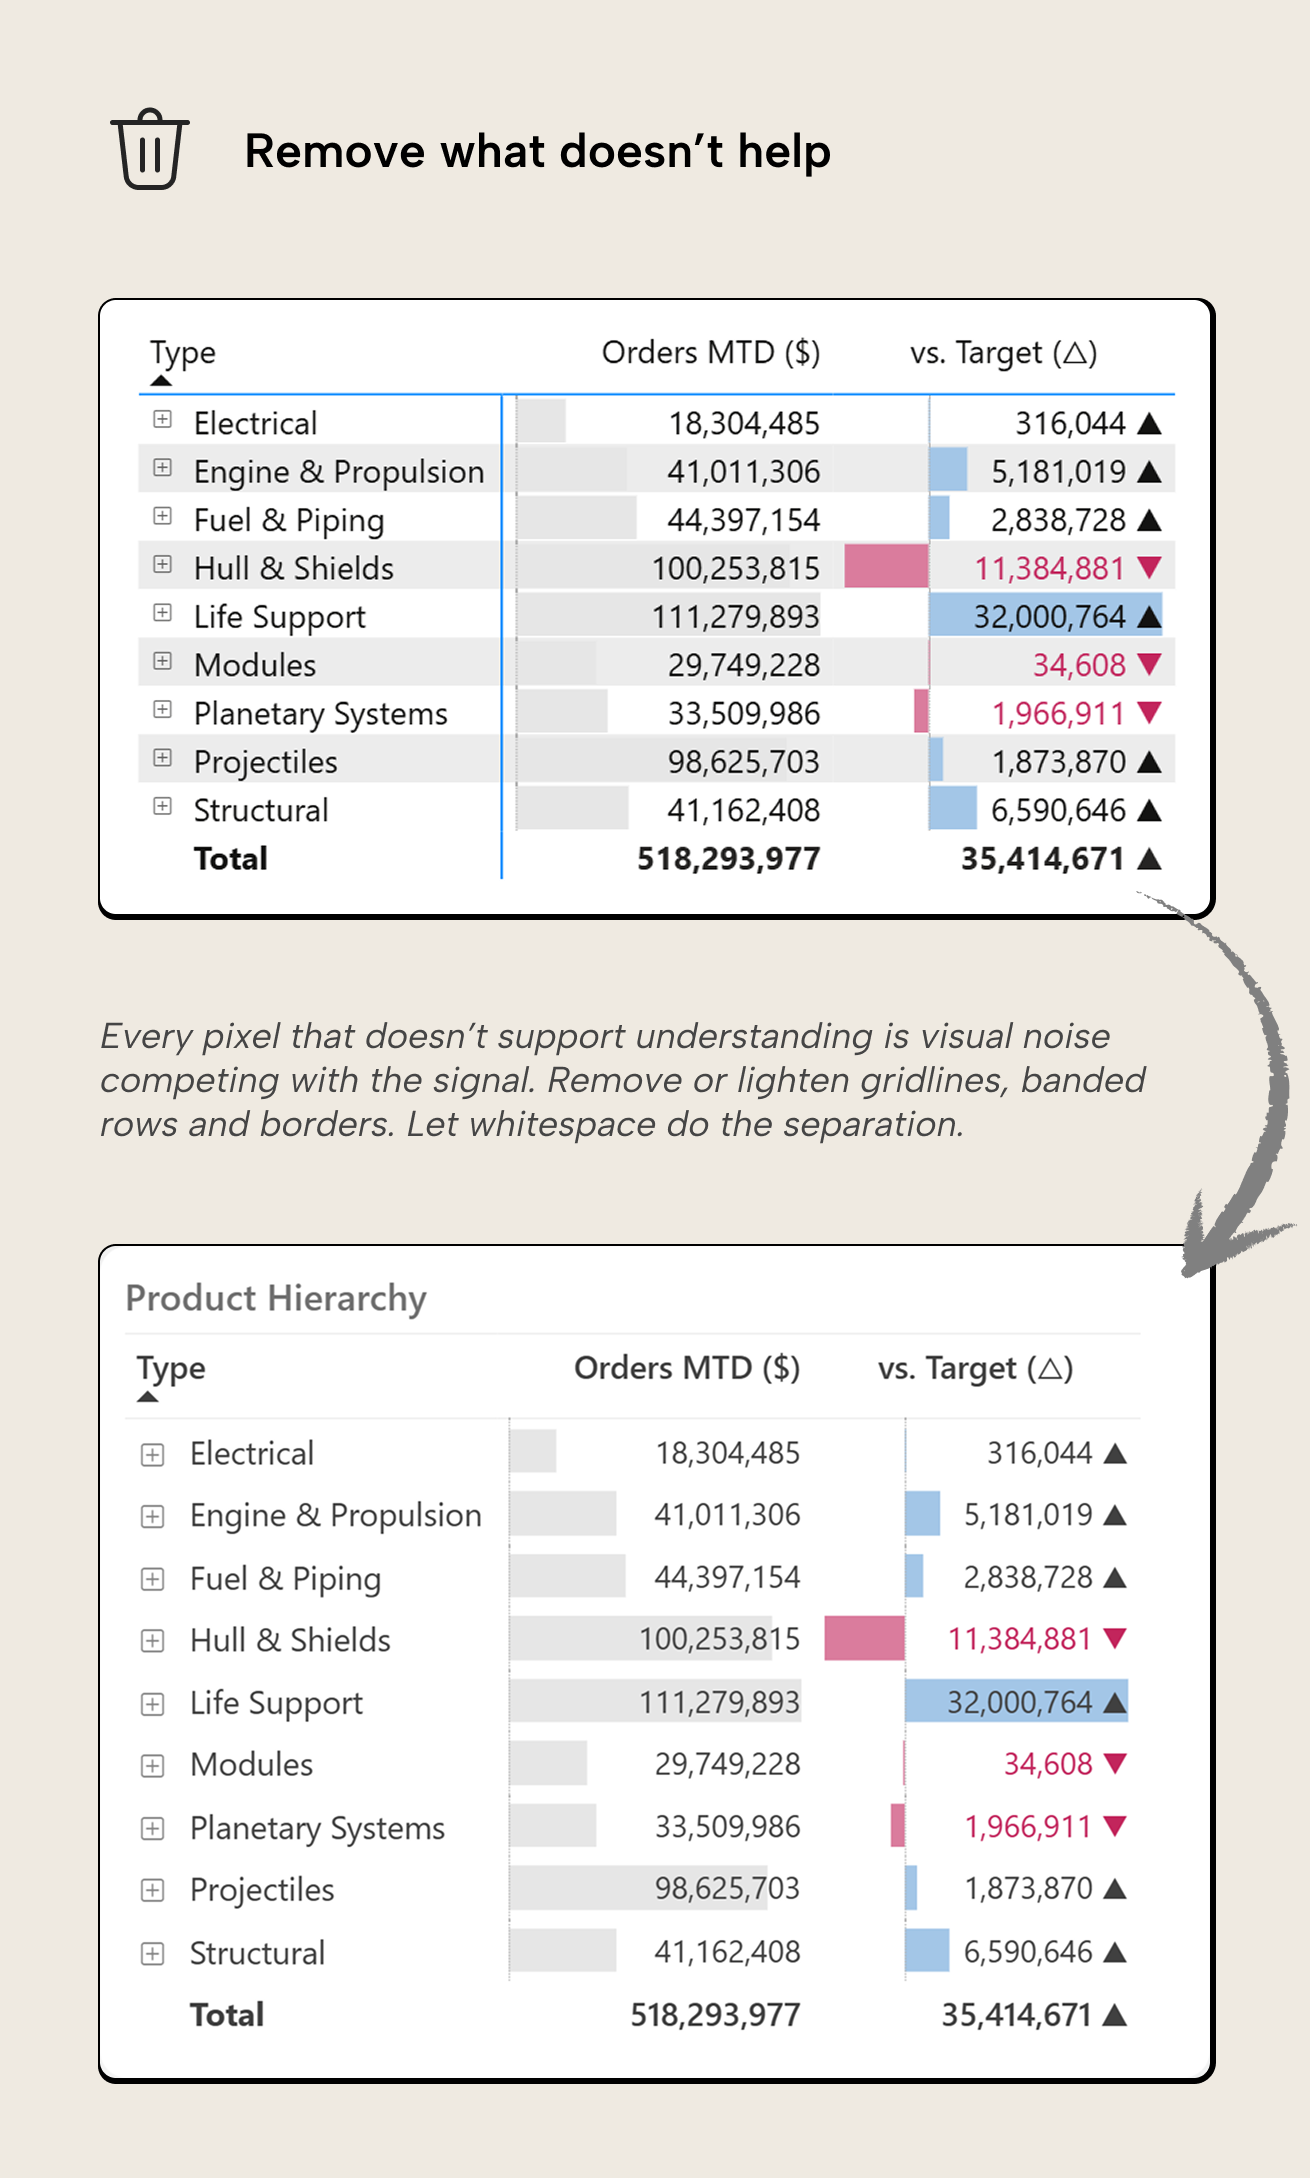
- Remove what doesn't help. Grid lines, banded rows, and borders are not always helpful. They add visual noise that competes with the signal. Strip them back and let whitespace do the separation instead.
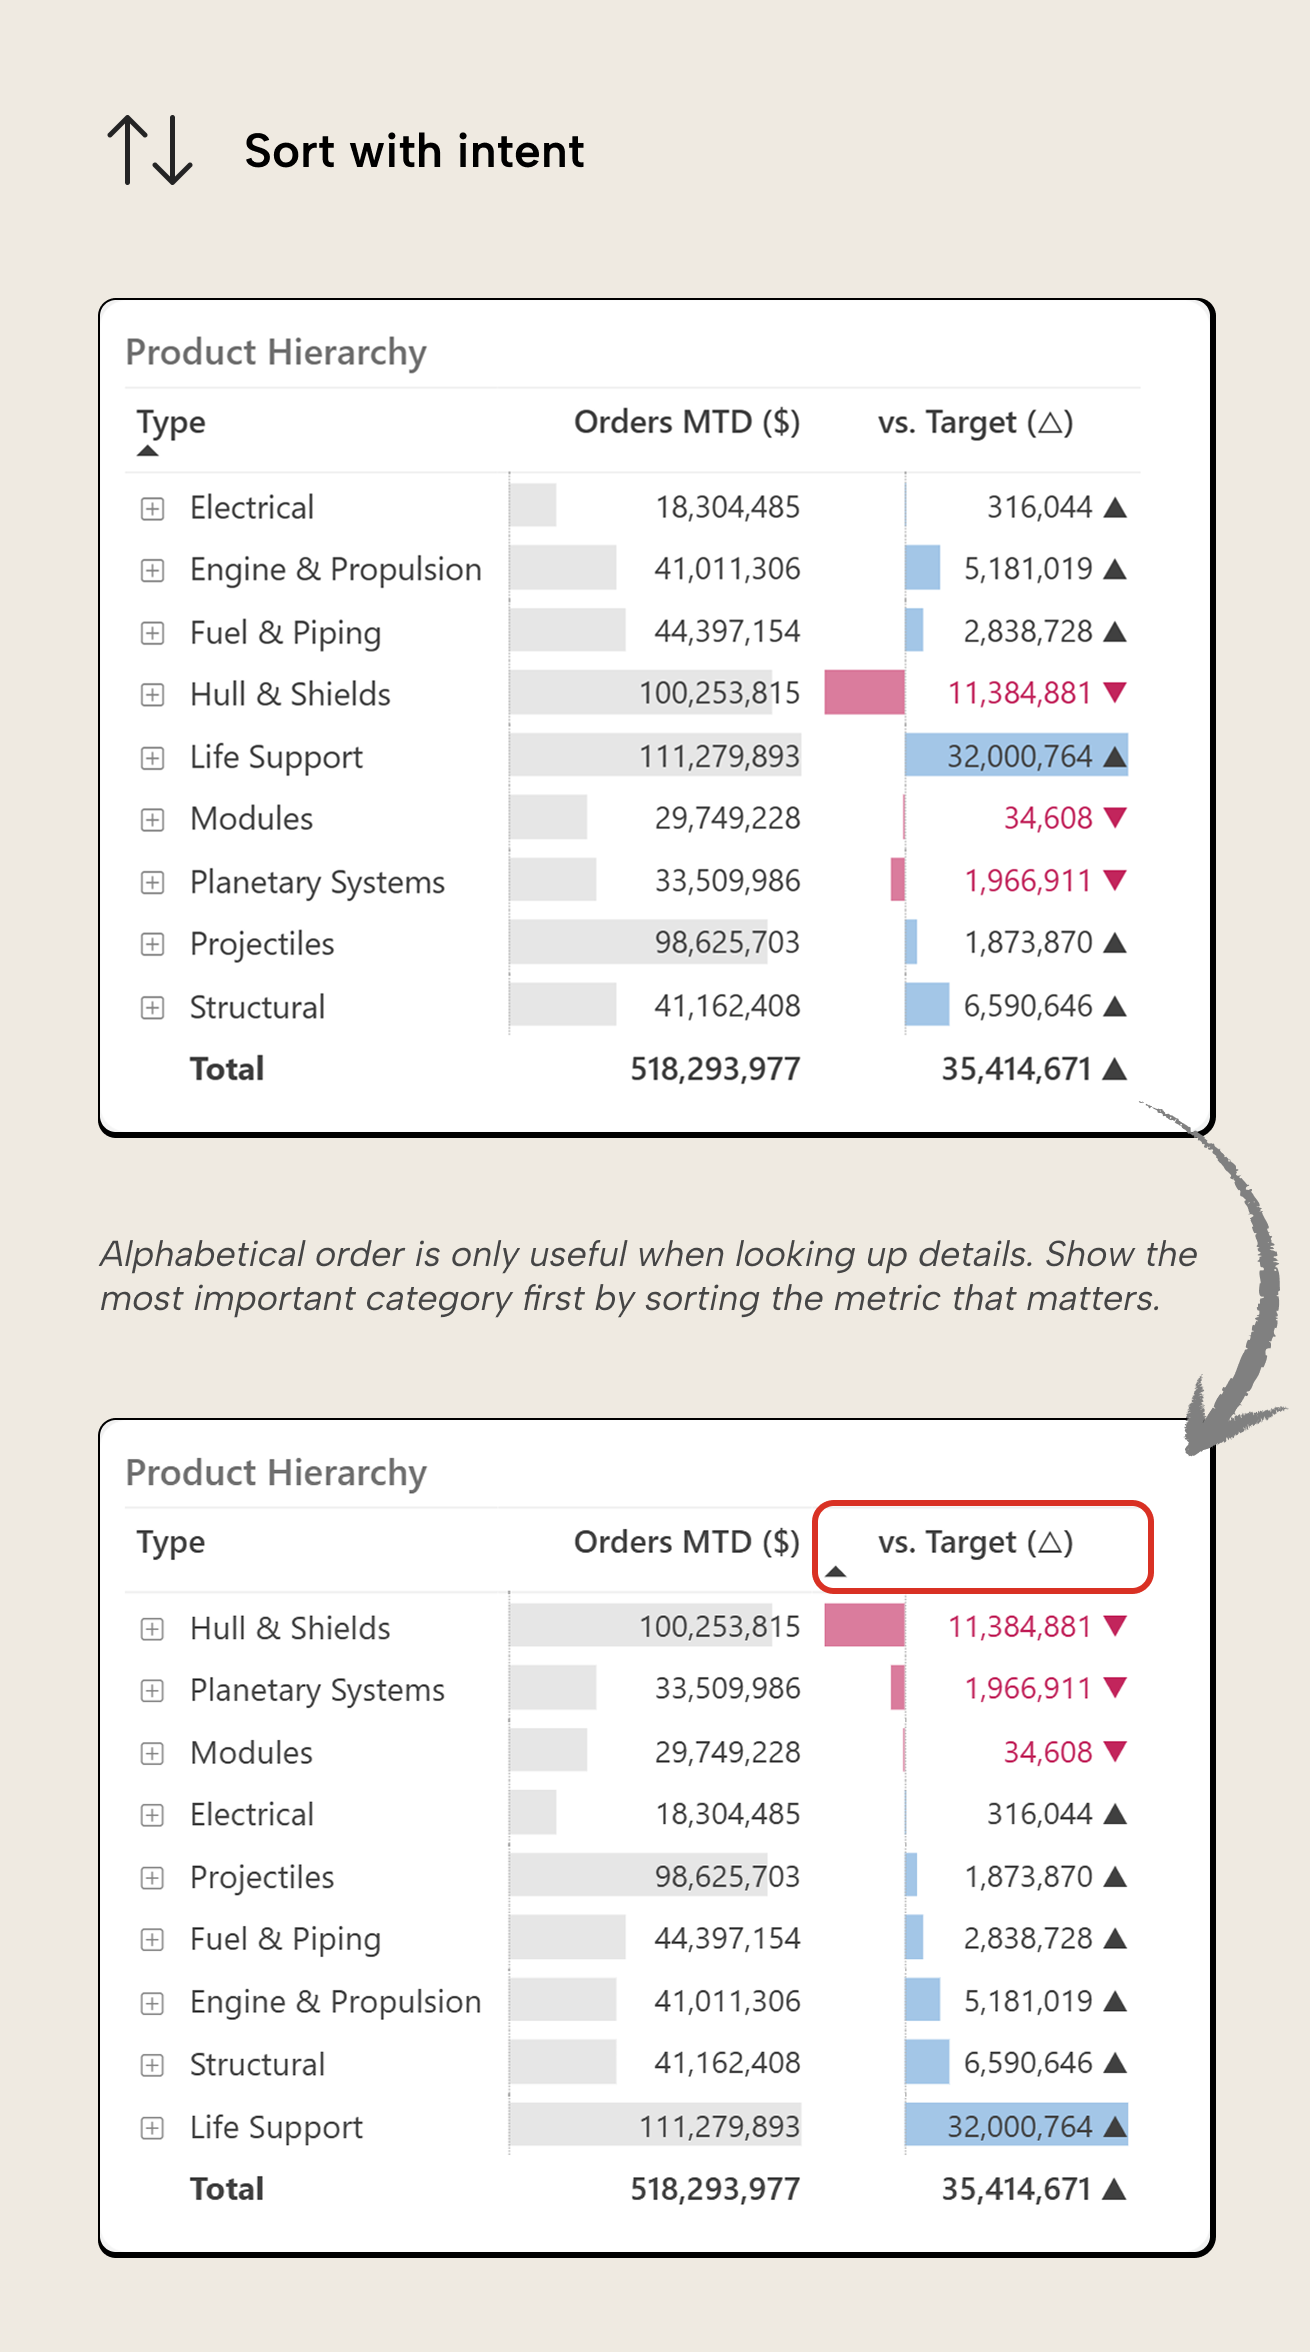
- Sort with intent. Alphabetical order rarely answers a useful question. Sort by the metric that matters most, so the reader's eye lands on the answer immediately.
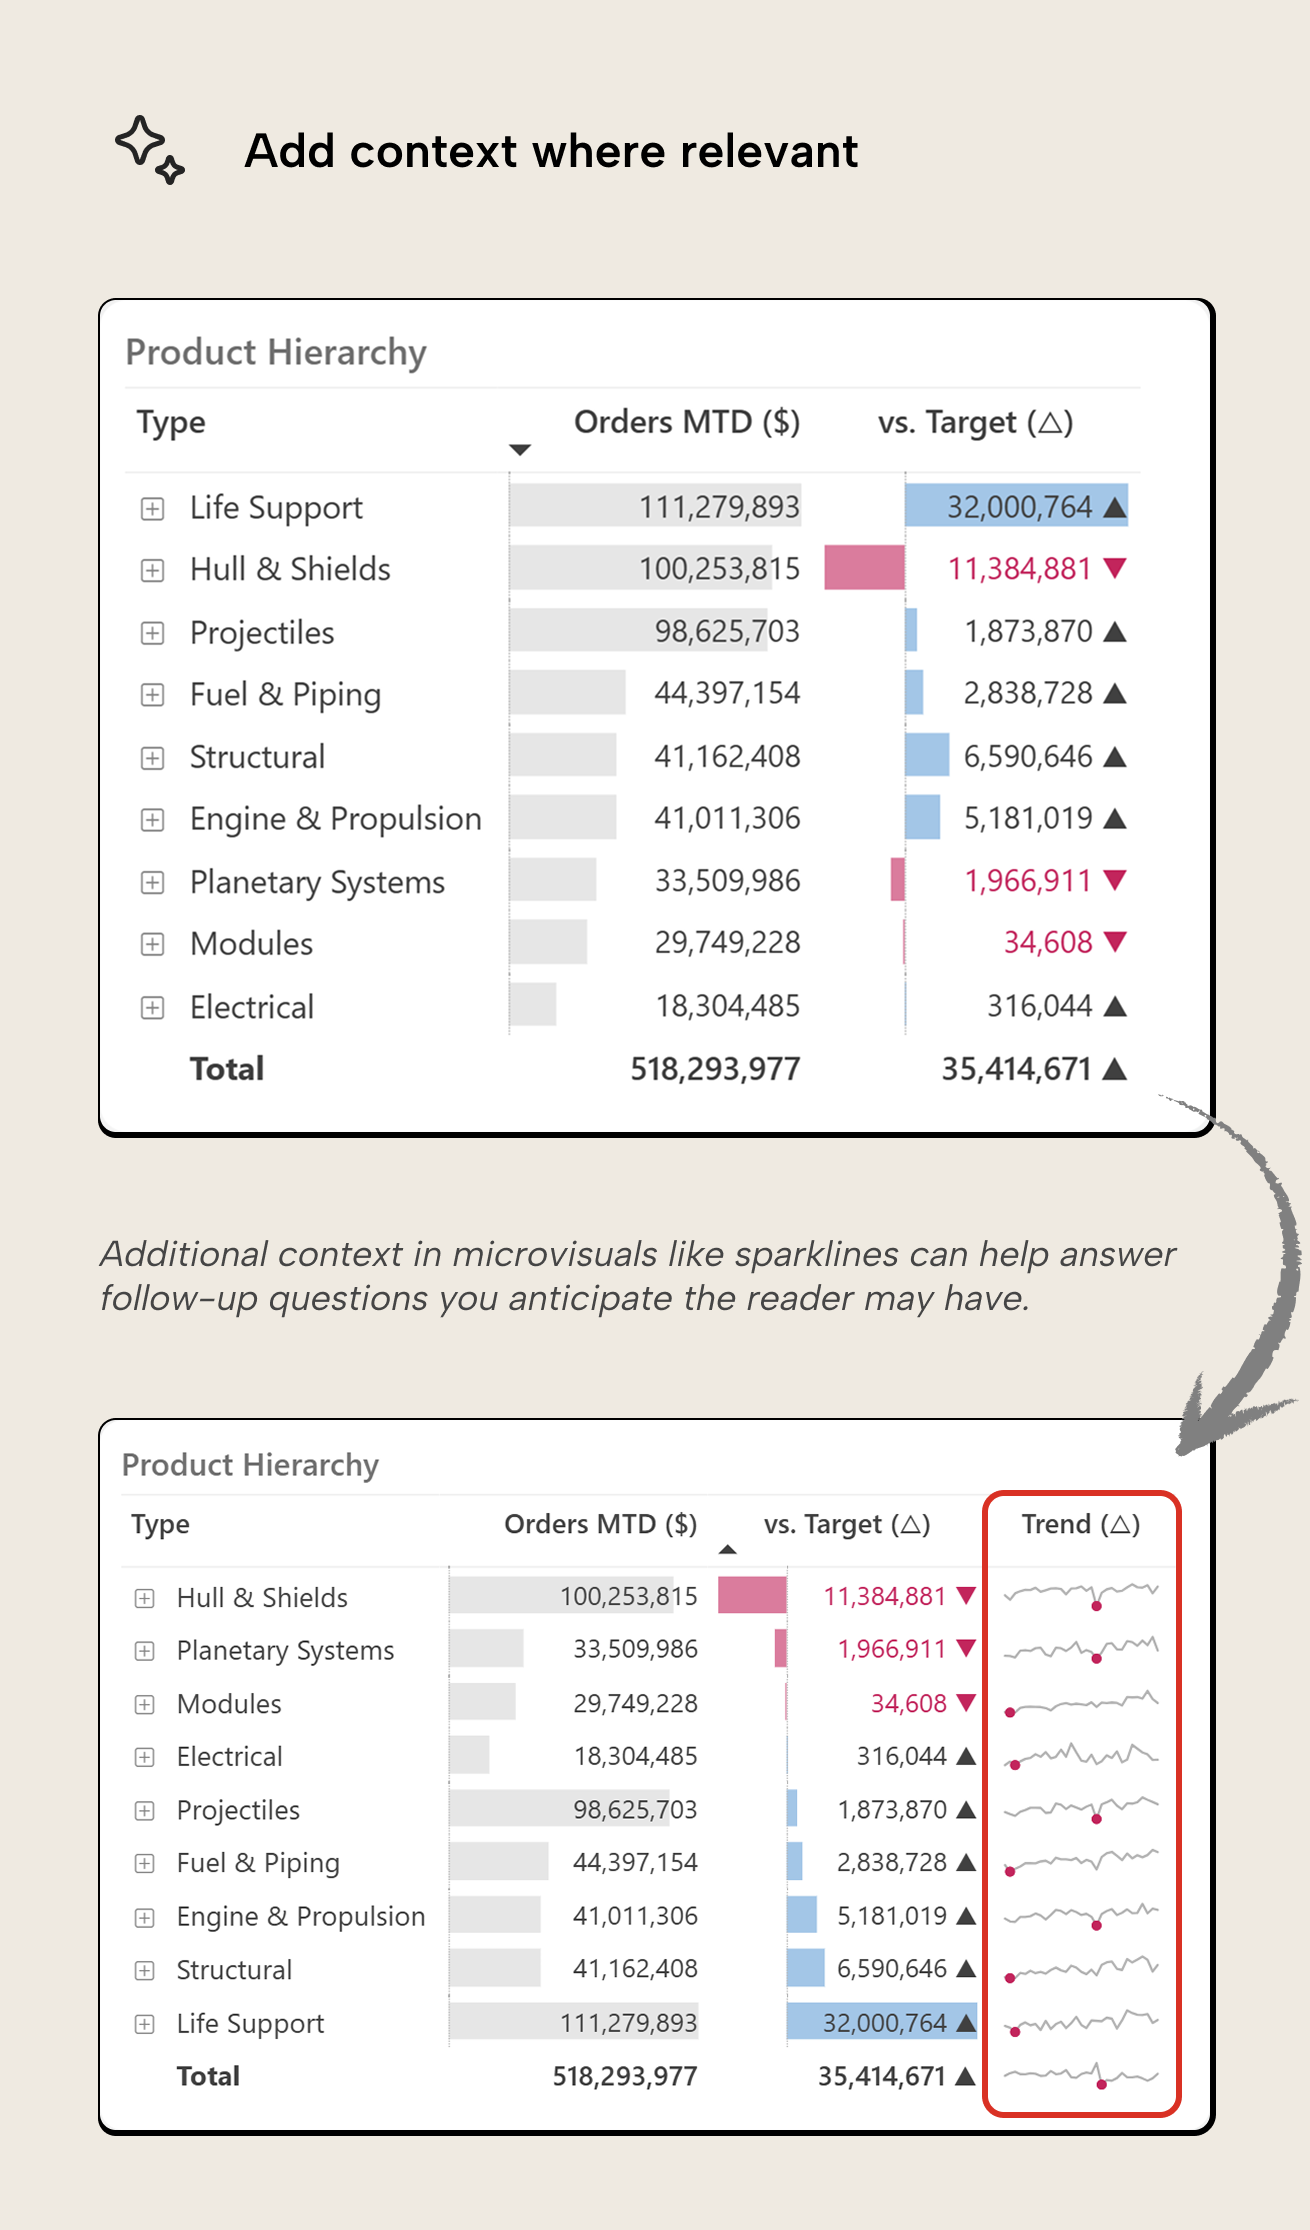
- Add context where relevant. A single metric to indicate gap vs. target tells you the situation today but not whether its performance has been improving or declining, often an important distinction that drives which actions to take. A sparkline column can help answer that question, adding a compact trend line that can paint a different picture than the single gap value.
None of these steps are technically difficult. The hard part is making the choices, and that's the part you shouldn't skip.
TIP
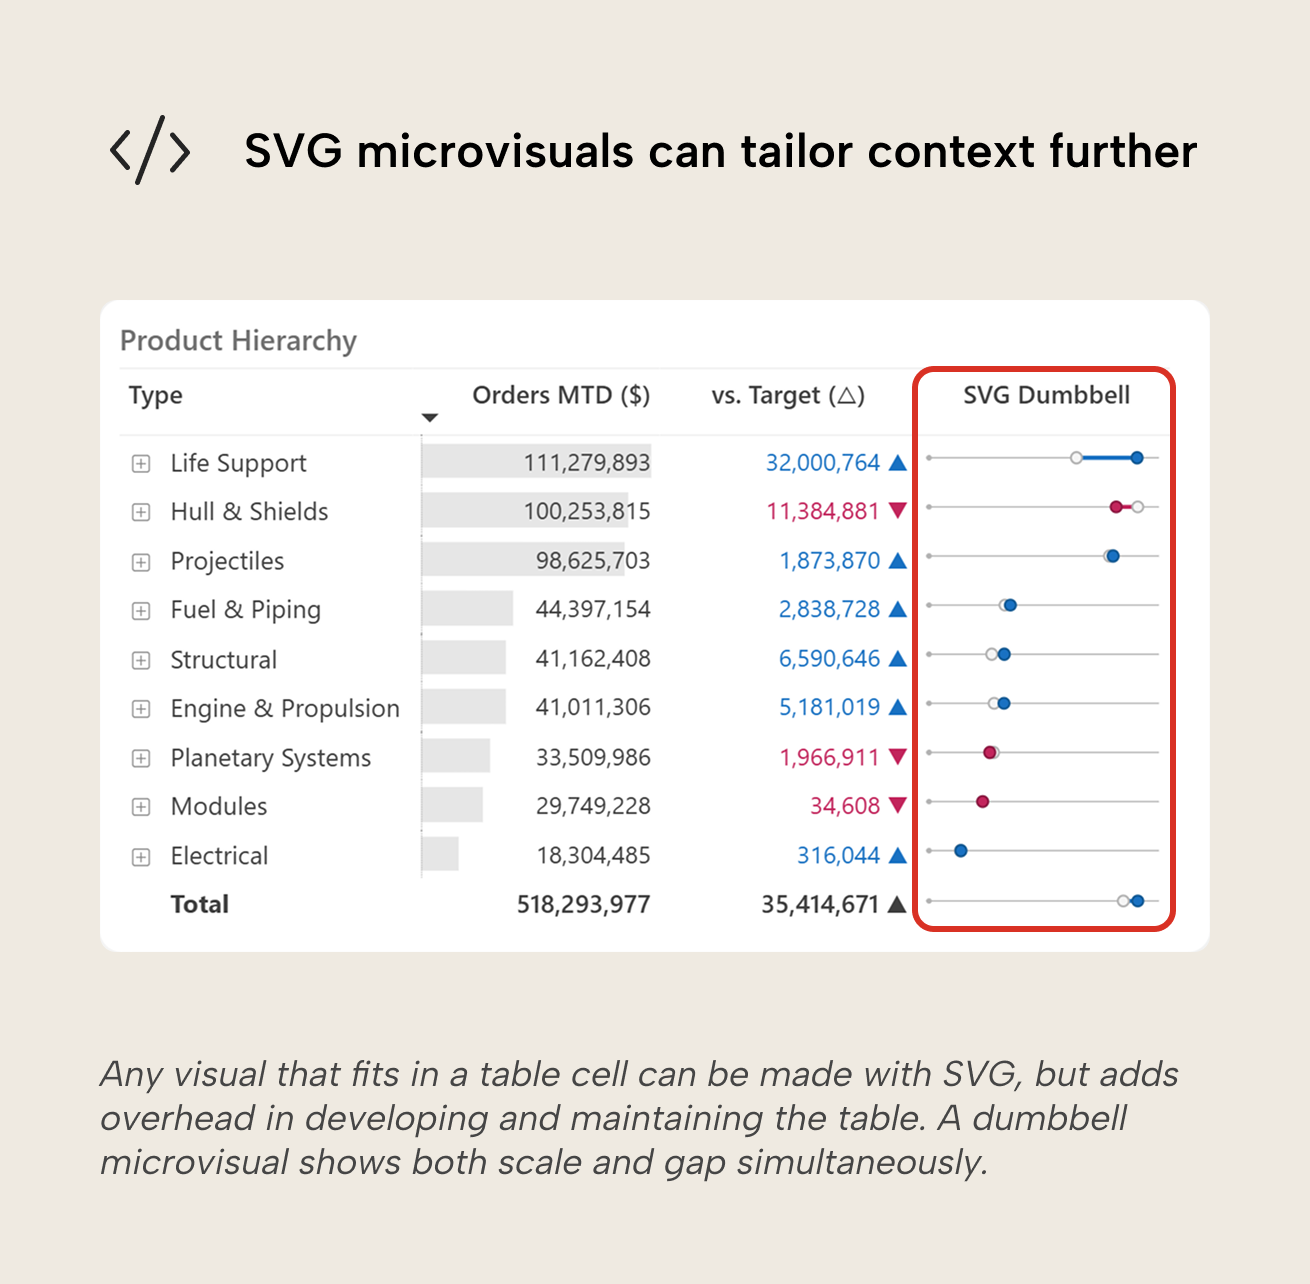
Sparklines are Power BI’s only default compact visual for tables. While useful, sometimes you may want to go a step further. SVG-based compact visuals are highly flexible but make the report harder to maintain and change over time. It’s up to you – the author – to decide whether the overhead is worth the gain for the readers.
Can AI do it for us?
AI agents can now generate visuals and even entire reports from natural language prompts. This can be useful for removing unnecessary friction: handling tedious UI interactions, generating boilerplate DAX, or exploring technical possibilities you might not know exist due to gaps in Power BI knowledge. Just as agents can accelerate semantic model development, they can assist with report creation... but they still need clear direction and context. The Power BI report format is complex, and without proper understanding of what makes a report "good" (as we've discussed), agents will confidently generate technically correct but ultimately unhelpful tables and dashboards.
Human judgment needs to define what to build and why. More specifically, the Large Language Models (LLMs) powering coding agents are trained on text and generate text. When an LLM builds a Power BI report, it’s manipulating a textual representation of the report format, not “seeing” the result the way humans do. Vision models exist that can interpret and generate images, but their model of vision has very little in common with how we humans actually process what we see. Our brains rely on perceptual heuristics – e.g. grouping, contrast and pattern recognition – that let us near-instantly judge whether a visual “works” for the data it’s displaying. No generative AI model currently replicates that. So while an agent can assemble a report, AI can’t yet truly evaluate whether the report communicates the message effectively to a human audience. You have to do that.
For further reading
- Visualization overview (Tabular Editor). Our introduction to the data visualization series. This article on tables is a specific implementation of the cognitive underpinnings set out there.
- Interaction design guide (Tabular Editor). How slicers and cross-filtering interact with tables and matrixes, an important dimension of deliberate report design.
- Report layout framework (SQLBI). A framework for structuring the information hierarchy of a report, directly applicable to deciding when a table is the right visual at the detail level.
In conclusion
Tables aren’t going anywhere, nor should they, so formatting them so they’re better suited for human perception just makes sense. AI can speed up the execution of building and formatting tables, but deciding when to use them and what they should meaningfully display is up to you. Start with the reader's question and format the table to answer it.
Support clearer tables and matrixes with better measures in Tabular Editor 3.
Give Tabular Editor a spin