
Key takeaways
- Start with a star schema: It's the preferred way to model data for Power BI; only deviate when requirements genuinely don't fit.
- One Big Table has narrow uses: It can be easier for one-off analyses or prototyping, but it's usually a transitory state before proper modelling.
- Snowflake schemas are situational: They can help when fact tables sit at different detail levels, but may be suboptimal for performance in Power BI.
This summary is produced by the author, and not by AI.
Model designs
During the planning and requirements gathering stage of your Power BI project, you should figure out how you will structure your data to make it useful for analytics and reports. This is the very essence of data modelling in Power BI, which involves investigating and transforming data, then connecting related tables and eventually creating calculations with DAX (which you do in various ways and places). The key outcome of this stage should be the planned design of your data model, documentation about how it will work, and potentially a proof-of-concept with representative sample data.
There are various kinds of data model designs, which are suitable in different scenarios. The following diagram gives you a quick-reference overview of three different approaches to data modelling in Power BI:
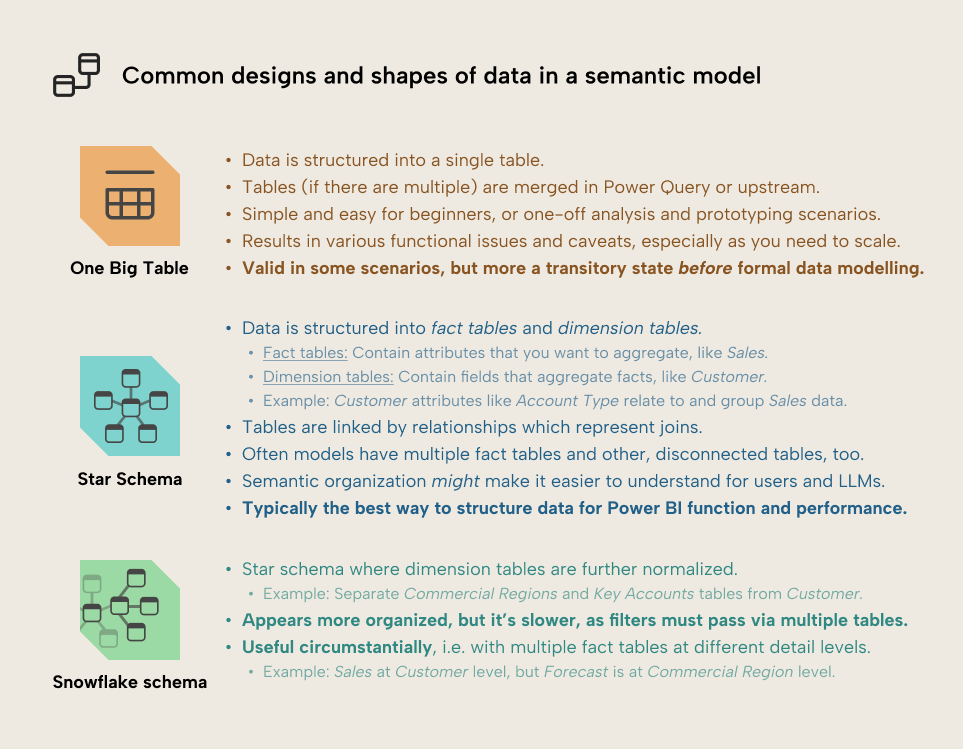
In this article, we explain the various types of designs with some examples and tips on when to use or choose them.
Helpful references
Before we discuss semantic model designs, we recommend some of our other introductory articles that explain what a semantic model is and why it is important:
- What is a semantic model in Power BI: a simple guide. This article answers some fundamental questions about what semantic models are.
- Semantic models in simple terms. This article introduces the basic theory and is more detailed.
- Creating your first semantic model in 2025. This article walks you through some of the most basic steps to create a semantic model and provides links to helpful references.
You will also find the other following articles helpful:
- Power BI is a model-based tool (SQLBI). This article from SQLBI is important for anyone new to Power BI to understand that while Reports or Copilot might be what draws people to Power BI, it’s fundamentally a tool for making and using data models, at its core.
- Microsoft guidance on dimensional design. This documentation explains in detail what a star schema is, why it is useful, and some general guidance on how to make it.
- From frustration to optimization: a journey through Power BI data model design (Marc Lelijveld). This article explains additional details you should consider to plan and optimize your model in Power BI.
One big table (OBT)
In some tools, you can only analyze your data by combining tables together with joins and producing a single table for all your visualizations and calculations. In Power BI this is also possible, and it’s actually quite a common way for beginners and people coming from other tools to structure their data for visualization and analysis. Depending on your preference and technical skills, this can be the most convenient way to analyze data. Generally, there are three scenarios where this might be appropriate:
- You are a beginner with Power BI or teaching/working with beginners who have no experience in data modelling. For beginners, one big table is simpler and easier to understand. The data structures show the data as it is, which means that they can always visually inspect the data without having to imagine abstract concepts like extended tables created from multiple tables linked by relationships. Especially for smaller data volumes, this might be the most straightforward approach.
- You are performing a quick, ad hoc analysis or creating a prototype. Here, you might forego higher effort data transformations to just explore, validate, or visualize the data. This is quite common during the requirements gathering or testing stage of a project. Just make sure that this choice is well-documented and you understand that moving the data into production might require additional modelling effort or different designs.
- You only have a single table available, and no control of the data source or ability to transform it, downstream. An example of this might be if you can only connect to the data by using DirectQuery or Direct Lake (due to policy restrictions or decisions from others). You might also only be able to retrieve data from a system or file that is in one big table. You can normalize this in Power Query (if you have no other tools available), but this might be prohibitive in performance for your refresh.
NOTE
If you are forced into a particular design pattern by policy restrictions or decisions from other people, you should still evaluate whether that design is appropriate. You might still be able to have a conversation with those decision- or policy-makers to put forward good arguments to change their mind and get a better result for everybody involved. This is particularly true if these policies have existed for a long time, irrespective of changes to how people in your organization are using data, or changes in the tools. It might also result in a less painful development experience for yourself, too 😊. Structuring your data into one table can work for some limited scenarios, like the ones mentioned above. However, in Power BI, there are quite some caveats of this approach, such as the following:
- Functional limitations: There are many reporting or analytics scenarios that you cannot easily address with this design. For instance, calculations for dates and times do not work well without a separate Date table, which helps facilitate DAX time intelligence in Power BI. You might also only have attributes present in transactions, which can lead to misleading visuals that do not include these values. For instance, if you report sales by month and have no sales on weekends, then those days will be completely absent from your graph. To add them, you must use a date table with a complete list of all dates.
- Performance challenges: In general, Power BI’s technical engine assumes that your model follows a star schema design (discussed later). If you have one large table with all your columns, you typically have a larger model, which can lead to slower reports. Further, if you are merging all your tables in Power Query, then you very likely will have slower data refreshes. Filtering and querying data can also be faster with a star schema than one big table. However, broadly speaking, performance differences between one big table and a star schema does depend on query patterns; some aggregations might actually be quicker on a single table. Note that aside from this reference, there’s limited evidence showing meaningful query performance differences in representative business scenarios.
- Problematic data structures: When you need to join tables together into one big table, you can end up with missing or duplicate data. Typically, this occurs when you join tables that have data at multiple detail levels. An example might be if you want to perform an analysis of customer sales performance against a forecast. Customer sales from the source system might be at the detail of Customer Sold-To by Billing Date, whereas the forecast might come from an Excel file and be at Account Group level by Forecast Month. Joining these two tables together without first aggregating sales to the same detail as forecast will lead to duplicating the rows of the Forecast table, or losing rows from the Customer Sales table.
- Limited reuse: If you structure your data into one big table in a source system, then it is harder to re-use that table for other scenarios. For instance, you can’t have re-usable attributes semantically organized together, like a separate table for Customer or Product. As such, you might end up in a scenario where multiple tables are redundantly created for different reporting scenarios, analyses, or even visuals. This is common to see in organizations that rely on data export tools (one example being SAP Business Explorer queries from SAP Business Warehouse), which typically expose such tables to business users with various filters.
- Difficulties scaling: As your data volumes increase, one big table presents some unique challenges for you to scale. For instance, if you want to set up incremental refresh or slowly changing dimensions, this becomes problematic with a one big table design.
Structuring your data into one big table is generally something that you might think of as more of a temporary, transitory state before you need to perform proper data modelling. It’s suitable in some scenarios like the examples given above but has many caveats. One big table can be a perfectly valid approach if it works for your scenario and you don’t run up against the caveats mentioned above or others.
That said, generally, you might want to consider working toward a star schema design to get the most from Power BI.
Star schema
The star schema is generally considered the preferred design approach for semantic models in Power BI. It involves structuring your data into multiple tables such that you have:
- Fact tables that contain quantitative attributes that you want to measure
- Dimension tables that contain descriptive attributes that group and categorize data from fact tables.
A strict definition of a star schema considers a single fact table with multiple dimensions. However, this is quite uncommon in real-world scenarios. In fact, most models have more than one fact table, as well as various disconnected tables to support reporting scenarios like parameterization, dynamic selection, and others.
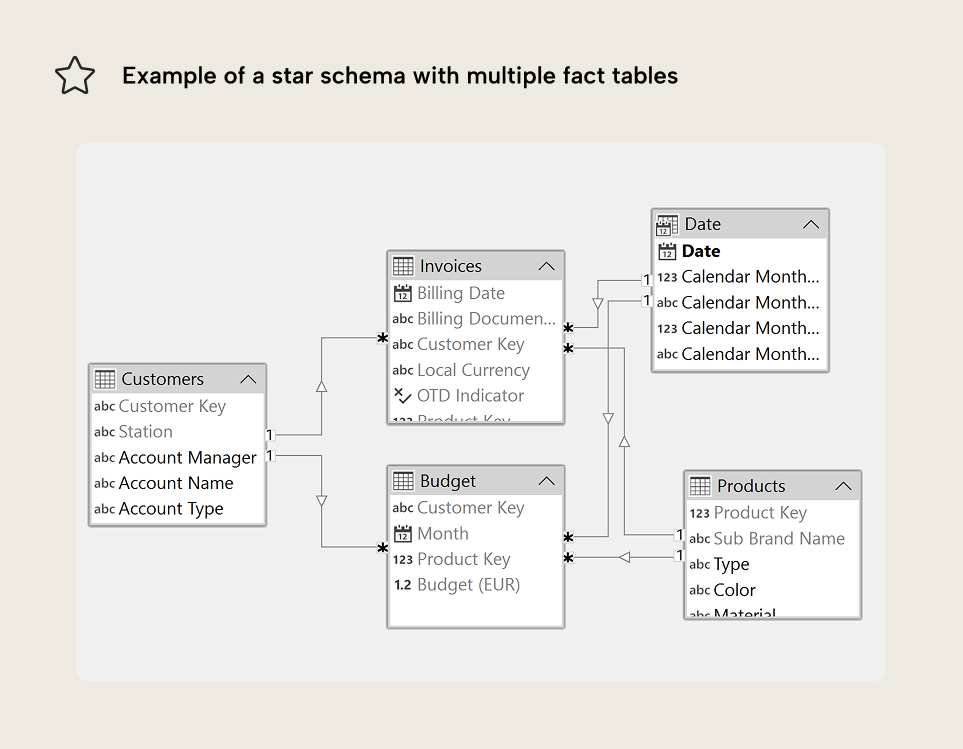
The following shows you an example of what a star schema model looks like, where the Invoice and Budget tables are fact tables, which are described by Product, Customer, and Date dimension tables:
This is typically called a star schema because simple depictions of the model diagram can be arranged to look like a “star”, such as the following image from the Microsoft documentation:
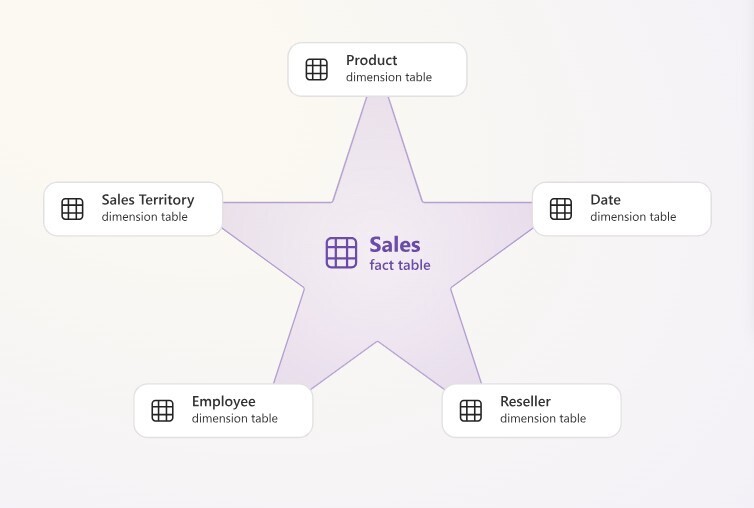
Image taken from Microsoft's dimensional design guidance.
To reiterate, the example above shows a single fact table and five dimensions. Again, most models have a mix of fact tables, dimension tables, and other, supporting structures. These can include disconnected tables, calculation groups, parameter tables, and other objects that support reporting functionality.
In general, the star schema is the preferred model design for Power BI suitable for most scenarios. Your model should not resemble the perfect star schema, but you should be striving toward the general direction of what an effective star schema design would look like for your data and your scenario. Some benefits of the star schema design include:
- Smaller model size: By normalizing your data you can better conform to how Power BI compresses it. This means that your models can be smaller and thus more performant. Depending on your license, you might also have strict size limits to publish models. In OBT, you'll repeat non-unique data values on every row. For example, you will have customer name and customer address repeated on every transaction row for that customer, whereas with a customer dimension, you'll only have these unique values stored once, linked to the fact table via a customer key.
- Easier management of tables: Structuring data for a star schema often comes with various practical benefits when it comes to managing tables. Examples include:
- Easily adding new tables that can be grouped by the same dimensions. For instance, if you want to add a Sales Forecast to a model that already has Sales and Budget tables and is described by the same dimensions, this is trivial to do. You just have to include the new table and create the new relationships. The other tables remain unaffected. In one big table, you’d need to account for this in your data transformations, which takes more time and effort to set up and test.
- Better manage table data refresh. For instance, you can configure incremental refresh on a large Sales table to get only the most recent data, but refresh the entire Customers table to pick up all and any changes to Customer attributes.
- Organization (subjective): Structuring data for a star schema is typically done by grouping attributes according to their semantics; customer attributes in the Customer table, product attributes in the Product table, and so forth. This can make the model seem more organized, and generally, many will claim a star schema is easier to use for both business users and AI. While a logical assertion, truthfully, we can’t find any objective evidence that clearly demonstrates this over one big table or other designs. Further, you might achieve a similar organization by using display folders effectively to group related columns.
- Performance: We mentioned this already above, but Power BI and DAX are designed under the assumption that your model is shaped like a star schema. That means that you will experience performance benefits when following this design for most queries.
Some caveats of the star schema are:
- Complexity: Star schemas take more time, effort, and knowledge to construct well. A good model design has to account for not just the data modelling, but the upstream transformations to realize that design from the source data and the downstream consumption that necessitates certain design decisions. The reality is that creating a data model means wearing many different hats and diving into technical complexity. This can be intimidating and challenging for the majority of Power BI developers, most of whom come from a non-technical background. Note, however, that the time, effort, and complexity can also arise later with one big table once you run into its challenges and caveats, though.
- Difficulty to inspect or understand: Semantic models can be set up in ways that will produce incorrect or misleading results, but these errors will only surface if you explicitly test for them. An example could be using bi-directional relationships for synchronizing slicers or many-to-many relationships when you have mixed granularity. In other words, star schemas are generally understandable, but they do introduce some potential for confusion that the developer might not subjectively experience with one big table.
- Certain DirectQuery scenarios: Some evidence may suggest that one big table might be better when querying a source system directly, since joins (from relationships in a star schema) can be computationally expensive. This is difficult to extrapolate, though, and should be validated on a case-by-case basis.
In general, a star schema is worth your investment. It will help you to get more from your Power BI data model, and the downstream items or AI tools that consume it.
We want to emphasize a few take-away to keep in mind:
- The star schema is the preferred approach to model data for Power BI. Start with a star schema; then, only when you have requirements that don’t fit your scenario, it might be reasonable to deviate.
- Most models don’t have a single fact table with dimensions. Your model doesn't need to be a perfect star schema to be useful or well-optimized.
- Choose designs that best enable the scenarios that you need to support for your business, and don’t be afraid to deviate where necessary, presuming you understand the implications.
Snowflake schema
A variant of the star schema design is called the “Snowflake schema”. This involves further normalization of the dimensions, such that you have multiple dimensions that “branch” from a single dimension related to fact tables.
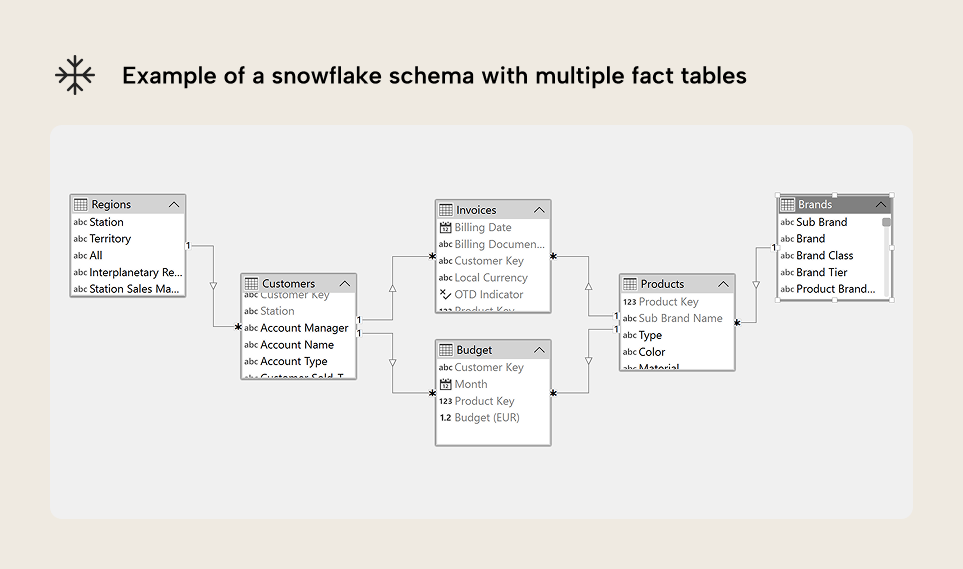
An example of a model with a snowflake schema design is below. The Regions and Brands tables branch off of the Customers and Products tables, respectively:
NOTE
If you want to see a representative example of what a Snowflake schema model might look like, you can check out the SpaceParts model. This is a free training SQL database that you can use to train and practice your data modelling, reporting, and analytics skills. For more information, check this article. A snowflake schema is sometimes considered to better organize or structure a semantic model by further dividing semantic groups or hierarchies into their own tables. This also has the added advantage of better supporting multiple fact tables at different granularity. For instance, consider the following example:
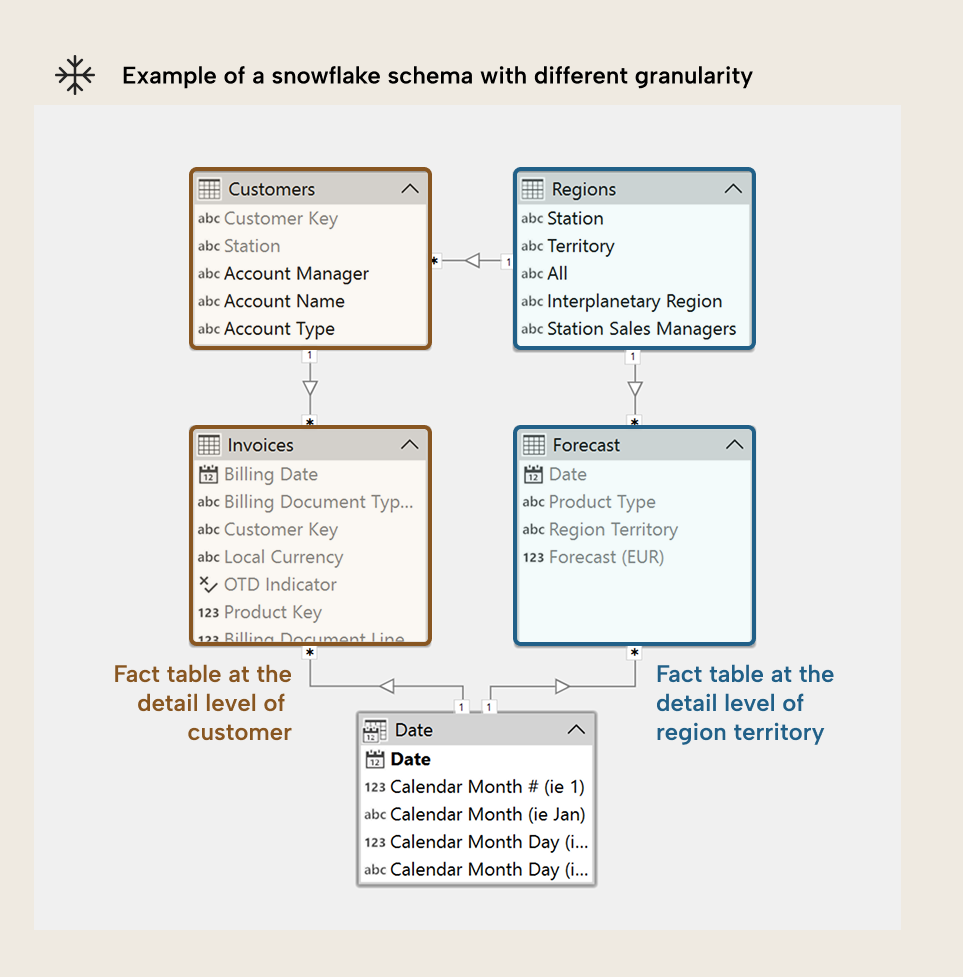
In the above example, if you have Invoices at the level of Customer but Forecast is at the level of Region Territory. In the snowflake schema, this might be useful, because you can relate the Forecast table to the Region table. This might be better than resorting to a many-to-many relationship with a bigger, single Customer table that contains both the customer and region attributes.
However, a snowflake schema has a key caveat in Power BI related to performance. With a snowflake schema, the additional relationships mean that filters have to propagate further, which can have a performance cost. Furthermore, more relationships take up more space in memory, which can lead to a larger model, and they must be recomputed during refresh. Whether this performance impact is meaningful depends on the specific query and scenario. For smaller models with straightforward business logic and DAX, this might be negligible. However, more complex scenarios with high data volumes might want to consider this as another optimization step.
As always, it depends. The best answer is to test different approaches for your scenario and choose the one that works best for you.
Others
There do exist a variety of other, niche designs for semantic models. However, they’re usually extrapolated from data warehousing to Power BI semantic models, which is often a mistake that fails to consider the specific requirement and needs that a semantic model has. An example of this is Data Vault.
These other sorts of data warehousing or data lake modeling approaches are great as a base for ETL to build a star schema for reporting. Often, a star schema needs a more normalized source schema upstream to be built from, including other helpful data structures. Just because something doesn’t end up in the star schema doesn't mean that it isn’t valuable. It just might not be valuable for reporting at this moment.
For further reading
- Data model types, examples, and tips for Power BI (Part 1) (Tabular Editor). The companion article covers Import, DirectQuery, Direct Lake, and composite storage modes, which shape which design pattern you choose.
- Create semantic model relationships (Tabular Editor). Explains how to set up the relationships that connect fact and dimension tables, including how to handle many-to-many and inactive relationships.
- Microsoft dimensional design guidance (Microsoft). Microsoft's guidance covers dimensional design principles, fact and dimension table definitions, and why this structure improves Power BI performance.
- Single-table versus dimensional modeling (SQLBI). Compares single-table and dimensional structures in Power BI, with useful nuance on when performance differences appear.
In conclusion
In general, you can design your model to be one big table, a star schema, or a snowflake schema. You don’t necessarily need to follow these patterns in a prescribed, cookie-cutter way. Almost every data model out there “in the wild” has these patterns to some degree. However, each of them have various permutations and combinations unique to the organization and teams that made them. For instance, it is perfectly fine and normal that your model isn't a single fact table in a star schema, so long as this is an intentional and explicit design choice.
What’s important is that you understand that different designs patterns exist, and you can use them in different scenarios to get better results from Power BI.
Refine star schemas and model patterns in Tabular Editor 3.
Give Tabular Editor a spin