
Key takeaways
- Documentation makes or breaks BI: Well-documented semantic models enable collaboration, while poor documentation creates bottlenecks and confusion.
- Different users need different docs: Technical users and business users need different documentation, and LLMs can help bridge the gap.
- Take a workflow-first approach: Structured workflows automate the translation between technical complexity and business clarity more reliably than agents.
- Automate consistency: Example workflows can enrich keywords, format documentation, and run consistency jobs across your model.
This summary is produced by the author, and not by AI.
Documentation is the unsung hero of successful BI implementations. While well-documented semantic models unlock insights and enable collaboration, poor documentation creates bottlenecks and confusion. Large Language Models (LLMs) offer new ways to bridge the documentation gap between technical implementation and business understanding. However, it crucially depends on the audience.
Documentation workflows for semantic models
In this post, we'll explore how LLMs can enhance Power BI documentation workflows by addressing the distinct needs of different users. We'll show how a workflow-first approach can automate the translation between technical complexity and business clarity.
The documentation challenge: Different needs for different users
BI products, and Power BI reports specifically, have many different audiences. Several different personas interface with Power BI reports, each with distinct documentation needs. Let's examine two key personas from our previous blog posts: Alice the Analyst and Bob the Business user.
Alice is the technical expert who needs to maintain and edit measures. For her, the important documentation is code documentation - she needs to understand the technical implementation choices and design decisions that were made. This documentation lives in the source repository and consists of code files with inline comments and markdown files for broader explanation. Bob, on the other hand, is the business expert who needs to translate business needs into data. For him, documentation is useful for finding which measure represents the business need he's interested in. These documents live closer in the report or in separate documentation software like Azure DevOps or Confluence.
A guiding example: Product popularity measure
Imagine Alice creates this measure for relative product performance analysis. She wants to show the relative revenue share of the products as a score between 0 and 1. The product with the highest revenue gets a score of 1. If another product has half the revenue, it will get a score of 0.5, unless no product in the current selection has revenue. In that case the measure should surface NaN by design.
To solve this, Alice (with the help of her Copilot, GPT-5, and a few suggestions from Tabular Editor Core Developer Greg Baldini) writes the following DAX code:
Product Popularity (Within Selection) =
VAR TopRevenueInSelection =
    CALCULATE (
        MAXX (
            VALUES ( 'Product'[ProductId] ),
            [Total Revenue]
        ),
        ALLSELECTED ( 'Product' )
    )
RETURN
    MAXX (
        VALUES ( 'Product'[ProductId] ),
        [Total Revenue] / TopRevenueInSelection + 0
    )
While the logic works, this measure lacks the documentation needed for both maintenance and business adoption. For instance, what happens when there are no chosen products? Why is it safe to use the / operator instead of DIVIDE?
Alice's documentation needs (technical)
Recall that for Alice the Analyst her main documentation needs are code comments in the repository. For Alice, the main things documentation should do are explain why the code does what it does and what the code is supposed to do. The best description of how code works is the actual code itself, so documentation shouldn't restate how code works. Instead, it should document the important design choices that were made.
Looking at our example, Alice needs to understand:
- How does the measure work across grains? The measure has different behavior across the product grain versus category grain. This needs to be documented
- Why
/overDIVIDE? Using DIVIDE is often best practice. However, we use/instead ofDIVIDEby design. Generally, it will be slightly faster and handle 0-values effectively. It will only surface a NaN when no product in selection has revenue in the selection (0 / 0) – an intentional indicator that no reasonable values are available. - Why do we avoid ISINSCOPE here: blanking parents can hide drill affordances and make visuals look empty. In contrast, the bubble-up pattern (
MAXX ( VALUES ( ProductId ), ... )) renders consistently.
For the Product Popularity measure the documentation, good documentation would be two-fold: The high-level description (of the measure) and code-level explanations.
The high-level description would ideally look something like this:
**Measure Name**: Product Popularity (Within Selection)
**Description**: Ratio of each product’s [Total Revenue] to the *top product* in the current outer selection.
**Behavior**: at parents (Category/Subcategory), show the best child’s ratio (“bubbles up”).
**Output**: ratio in [0..1]; format the measure as Percentage in the model UI.
Note, that this follows a structured pattern. All measures would probably benefit from having their name, a brief description, notes on the behavior, and the structure of the output. This makes the task more suitable for an LLM.
The code comments, which live in the repository, could then be formatted like below:
Product Popularity (Within Selection) =
VAR TopRevenueInSelection =
    CALCULATE (
        // MAX product revenue across the *outer selection*
        // - VALUES(ProductId): iterate only products visible in the selection
        MAXX (
            VALUES ( 'Product'[ProductId] ),
            [Total Revenue]
        ),
        ALLSELECTED ( 'Product' ) // table arg removes inner Product hierarchy filters, keeps slicers/page/report
    )
RETURN
    MAXX (
        // Under the current node (product/category/…), take the best child’s ratio vs. the top in selection.
        VALUES ( 'Product'[ProductId] ),
        // `/` by design; 0/0 → NaN is intentional as a diagnostic.
        // `+ 0` coerces BLANK() to 0; it does *not* mask 0/0 → NaN.
        [Total Revenue] / TopRevenueInSelection + 0
    )
Here, Alice the Analyst can see exactly how the measure works, the scope, edge cases and so on. If she wants to optimize it, she knows the thoughts that came before. All in all, she can manage and change the code with more confidence.
Bob's documentation needs (business)
What Bob cares about is being able to find the right measure to translate business needs into data. The documentation should help him effectively search through the measure space and understand what each measure represents in business terms. Because he is mainly a report consumer, his documentation will need to live at the report level (separately from the code repository that Alice has access to).
For our Product Popularity measure, Bob needs:
- Business Translation: As we discussed in an earlier blog post, LLMs excel at translating between technical and business contexts. In our example, this could be converting "ALLSELECTED respects slicers" to "Automatically adjusts based on your current filters". However, for this to work properly, it requires a strong effort from Alice, to ensure the underlying semantic model is well-documented.
- Synonyms & Keywords: Good synonyms make searching easier. For this example, good keywords could be: "relative product performance," "product scoring," "comparative popularity," "product ranking".
- Usage Context: How to use the measure to answer business questions. E.g., how filtering by region/time affects the percentage score.
- Business Interpretation: What do the numbers mean? In our case, this means understanding the difference between grains and the interpretation of the score (i.e., the difference between within-category comparisons and between category).
In the documentation, Bob should be able to find these measures easily so he can answer questions quickly (without bothering Alice too much!).
How LLMs can enhance documentation workflows
Now that we have the needs, we can dive into how LLMs can facilitate this documentation process. LLMs can do at least two things for both Alice and Bob.
For Alice (technical documentation)
LLMs can help Alice in two key ways:
- Consistency Checking: LLMs can be used to check for inconsistencies between definitions and code. You can run a job that looks whether the code has changed but the documentation has stayed the same, and flag that for Alice to manage through another workflow.
- First-Pass Structuring: LLMs can help turn rough notes into structured output. If Alice writes roughly what a Measure is supposed to do, an LLM can turn it into a predefined structure (like the ‘Description, Behavior, Output’ format described above). The LLM can also flag if information is missing (e.g., about edge cases) - though LLMs are often overconfident.
Crucially, each of the above use cases help rather than replace the analysts. Both checking consistency and first-pass structuring ensure that the code lives up to well-defined standards and help the analysts maintain and improve the code.
For Bob (business documentation)
For Bob, LLMs can provide crucial translation and discoverability support:
- Keyword Enrichment: For all measures, an LLM can generate relevant synonyms based on the code and documentation. This can drastically improve search efficiency. These can be attached to the Power BI Q&A linguistic schema, so Bob can easily find them.
- Interactive Business Explanations: LLMs can help translate technical documentation into business explanations. Good translation is only possible, however, with very well-documented code and descriptions, which the previous steps should make easier to achieve.
Both of these use cases are about lowering the barriers to insights for business users. By making it easier for Bob to search through measures (through better synonyms) and help him translate technical concepts (through the LLM-powered), he’s empowered to do more independent analysis – all based on a strong foundation built by Alice and her colleagues.
The workflow-first approach
We have now seen what LLMs can do for documentation. Now the question is how to implement it in practice. One answer would be to implement a Documentation Agent (see our previous post for a definition). However, this would be shooting sparrows with cannons (as the Danish saying goes!).
Since we're dealing with relatively straightforward tasks (e.g., extracting keywords and monitoring documentation drift), this is much better suited as a workflow. As Phil Schmid, AI Engineer at DeepMind, says: The simplest solution is often the best.
Treating the processes as simple workflows makes them easier from a data governance perspective because you can treat the changes as code and use the useful toolbox of DevOps (Azure Pipelines, GitHub actions etc.) to manage them.
Why workflows over agents
The workflow approach offers several advantages:
- Controlled processes: Programmatic, predictable operations rather than unpredictable agent behavior.
- Data governance: Documentation changes can be treated as code with proper review processes.
- Integration: Fits naturally with existing development practices and version control systems.
In short, by making the LLMs into workflows, they can be treated as any other automatic workflow, be it a best-practice analyzer or an automatic code formatter. This makes LLMs less like magic assistants and more like useful tools.
Example workflows
In this section, I will sketch out two example workflows for improving documentation with LLMs. These workflows will be on a general level and not dive into the belly of the monster called the Linguistic Schema (which more seasoned BI-gurus have warned me to stay clear of!). In theory, it should be possible to structure the Linguistic Schema in a way that would allow an LLM to easily edit it (for instance, through an MCP), but this isn't a trivial matter. For this reason, we will also focus on Alice’s workflows as they (hopefully) live in source-controlled code repositories, which are much more friendly to automated workflows than user-friendly binary files.
Generally, workflows could run as CI/CD pipelines. For instance, the keyword enrichment and documentation formatter could run every time a new measure is created. This is illustrated below:
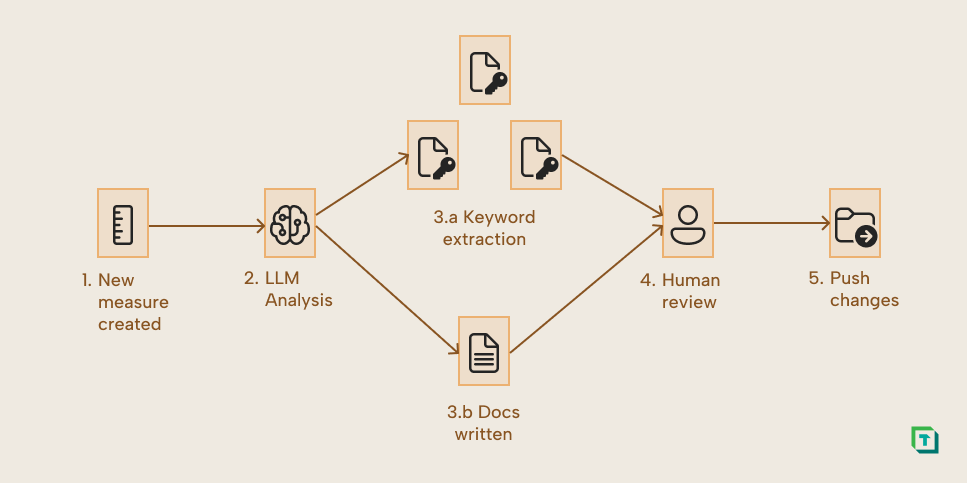
Here, every new pull request that implements a new measure would trigger an LLM script. This script would do two things: 1. Extract potential synonyms in a structured fashion (to enable integration with the semantic model) and 2. Check that the code comments and descriptions are available, follow the pre-specified formats, and provide a restructured draft when needed. Crucially, these changes are reviewed by a human (like Alice) before deployment.
Similarly, every time someone changes a measure, you can run a documentation consistency job.
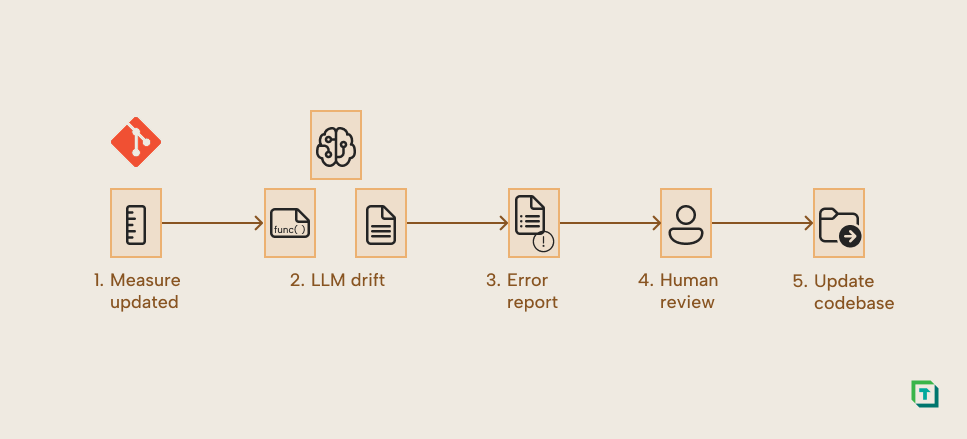
Here, the trigger is a changed measure. A script is then run that compares the code comments with the intended behavior and flags inconsistencies for the human reviewer. This would help Alice avoid documentation drift and create the foundation for Bob’s documentation workflows.
For further reading
- Querying semantic models with LLMs (Tabular Editor). The preceding article in this series: introduces Alice and Bob and the question-to-DAX workflow that the documentation patterns here are designed to support.
- The dark side of LLMs: Security risks in semantic model development (Tabular Editor). The next article in this series, covering what can go wrong when LLMs have write access to documentation or model metadata without sufficient human oversight.
- Different ways to create synonyms in Power BI Copilot (Chris Webb). Shows practical synonym patterns that support Bob's search and discoverability needs in report-facing documentation.
- Use Copilot with semantic models (Microsoft Learn). Covers Copilot's measure description generation feature, a practical implementation of the first-pass structuring workflow described for Alice in this article.
In conclusion
Documentation serves different needs - LLMs can automate the translation between technical implementation and business understanding. The workflow-first approach provides control and integration with existing processes, ensuring that documentation improvements enhance rather than disrupt established development practices.
By addressing both Alice's technical needs and Bob's business requirements through workflows, organizations can create documentation that truly serves both audiences. The key is treating LLMs as tools that enhance human expertise rather than replace human judgment.
In future posts, we'll explore advanced security considerations and techniques for scaling these documentation workflows across larger organizations. The foundation is solid - now it's time to build upon it.
Document semantic models with LLM support and Tabular Editor 3 metadata.
Give Tabular Editor a spin

