
Key Takeaways
- Profiling: Exploring and profiling data is an essential step in building semantic models.
- Trust: Data quality issues often end up in the model anyway, and even minor issues can undermine trust in the entire model.
- Workflow: Tabular Editor gives you different ways to explore and profile data with C# macros and the AI Assistant.
- Cost: Data profiling is computationally expensive by nature, because each macro fires real DAX queries against the connected model.
Introduction
Profiling your data before it lands in a semantic model saves rework and protects trust. Catch an issue before measures are built on top of it and it's a source fix; catch it after a user has run their first report and you’re managing a credibility problem on top of a data problem. Example patterns are distinct counts, blank rates, referential integrity checks and suspicious distributions. Catching these upstream, before measures are built on top of them, is far cheaper than catching them later. Our earlier article on preparing data for a semantic model covers that groundwork in detail.
In practice, issues slip through anyway. Requirements change mid-project, you inherit a model without documentation, a source system is updated without announcement and crashes the refresh. Data quality problems range from surface inconveniences to deeper monsters. Whitespace and unmatched keys accumulate quietly; they seldom break anything obvious. Undocumented assumptions, implicit correlations, a hardcoded division by 12 when a category grows to 13; these rarely announce themselves at all. The slight embarrassment when a user reports an issue that got past you is real, though. One-offs are usually forgotten quickly, but when models habitually have quality issues, trust in the entire model is undermined. The tools in this article address the surface layer. Deeper issues like account entries not balancing require domain knowledge no generic macro can encode.
Tabular Editor has tools for investigating this from inside the model: DAX queries, INFO functions, COLUMNSTATISTICS(), VertiPaq Analyzer, Dynamic Management Views (DMVs). VertiPaq Analyzer deserves a note: it fires its DAX queries to collect cardinality and encoding stats. VertiPaq Analyzer tells you about model structure: why is this column 400MB, how is it encoded? The macros in this article tell you about data content: what are the actual values in this column, and do they look right?
With all these tools at your disposal, you may be wondering what an efficient workflow to unearth and fix these issues could be. While there is no “Find All Issues” button nor a one-size-fits-all approach, below we show a useful generic pattern you can adopt and tailor to your needs: C# macros for a broad, structured scan across many columns at once, then Tabular Editor 3’s AI Assistant to investigate whatever catches your eye. Both tools are native to TE3; keeping the whole workflow in a single tool helps streamline the process and keep you productive.
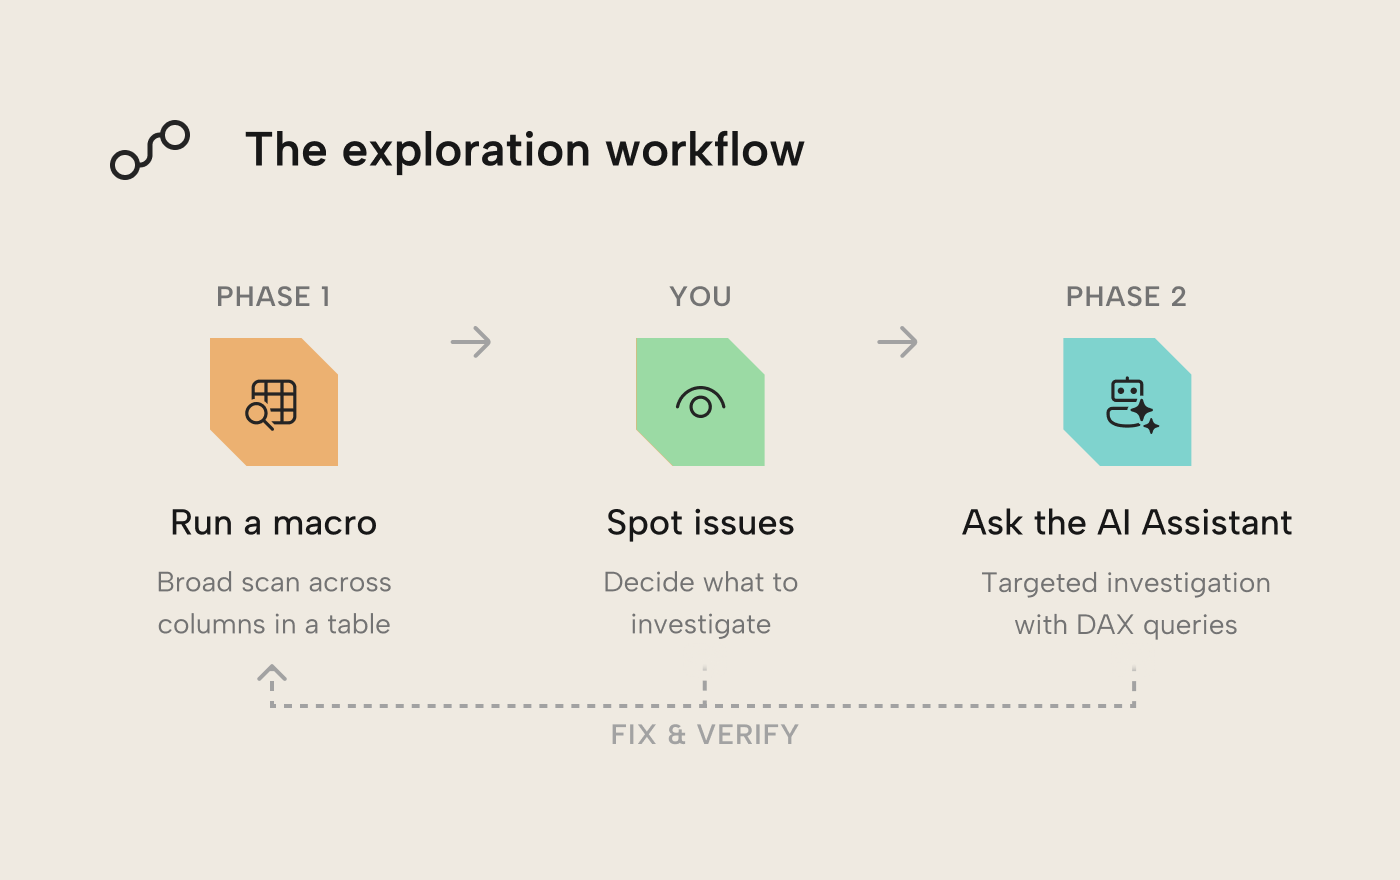
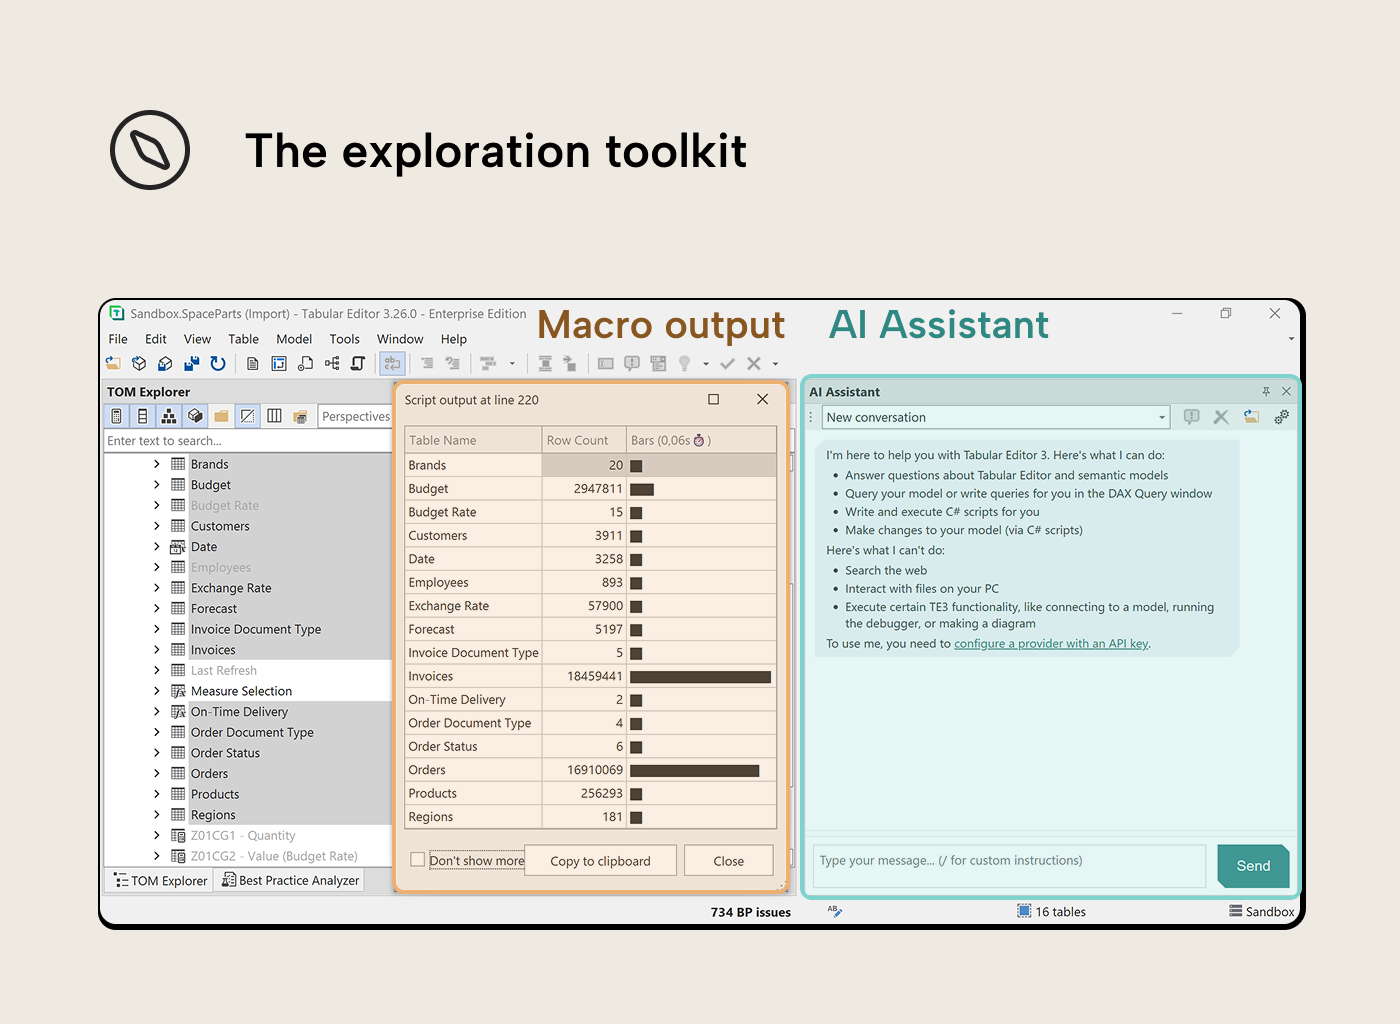
The exploration toolkit
C# macros (VizDataTableOutput collection): Select columns from a table, run a macro, get a data grid in TE3’s output pane, one row per column with relevant stats at a glance. The output uses Unicode block characters for bar charts and histograms; data visualization is useful wherever you need to understand data, regardless of how rich the rendering environment is.
AI Assistant (TE3 March 2026 release): A chat panel in the same IDE. Describe what you’re looking for, it writes a DAX query or C# script and can run it against the connected model on the spot. It’s most efficient when a macro surfaces something unexpected and you want to dig in: “How much total invoice value is sitting behind those unmatched customer keys?” is the kind of prompt that helps quantify the problem.
Neither tool works at arbitrary scale, though. The macros fire multiple DAX queries per column; on large fact tables the TopN variants (VizColumnProfilesTopN, VizColumnDistributionsTopN) limit the scan to the first N rows. The AI Assistant is targeted and conversational, but it needs something to aim at; that’s exactly what the macro output provides. Don’t ask the AI Assistant to spend tokens on what a macro can do deterministically and (virtually) for free; feed it a finding and let it investigate.
Phase 1: Scanning with macros
The VizDataTableOutput collection contains nine macros. The first six handle the broad scan; the last three target specific data quality dimensions.
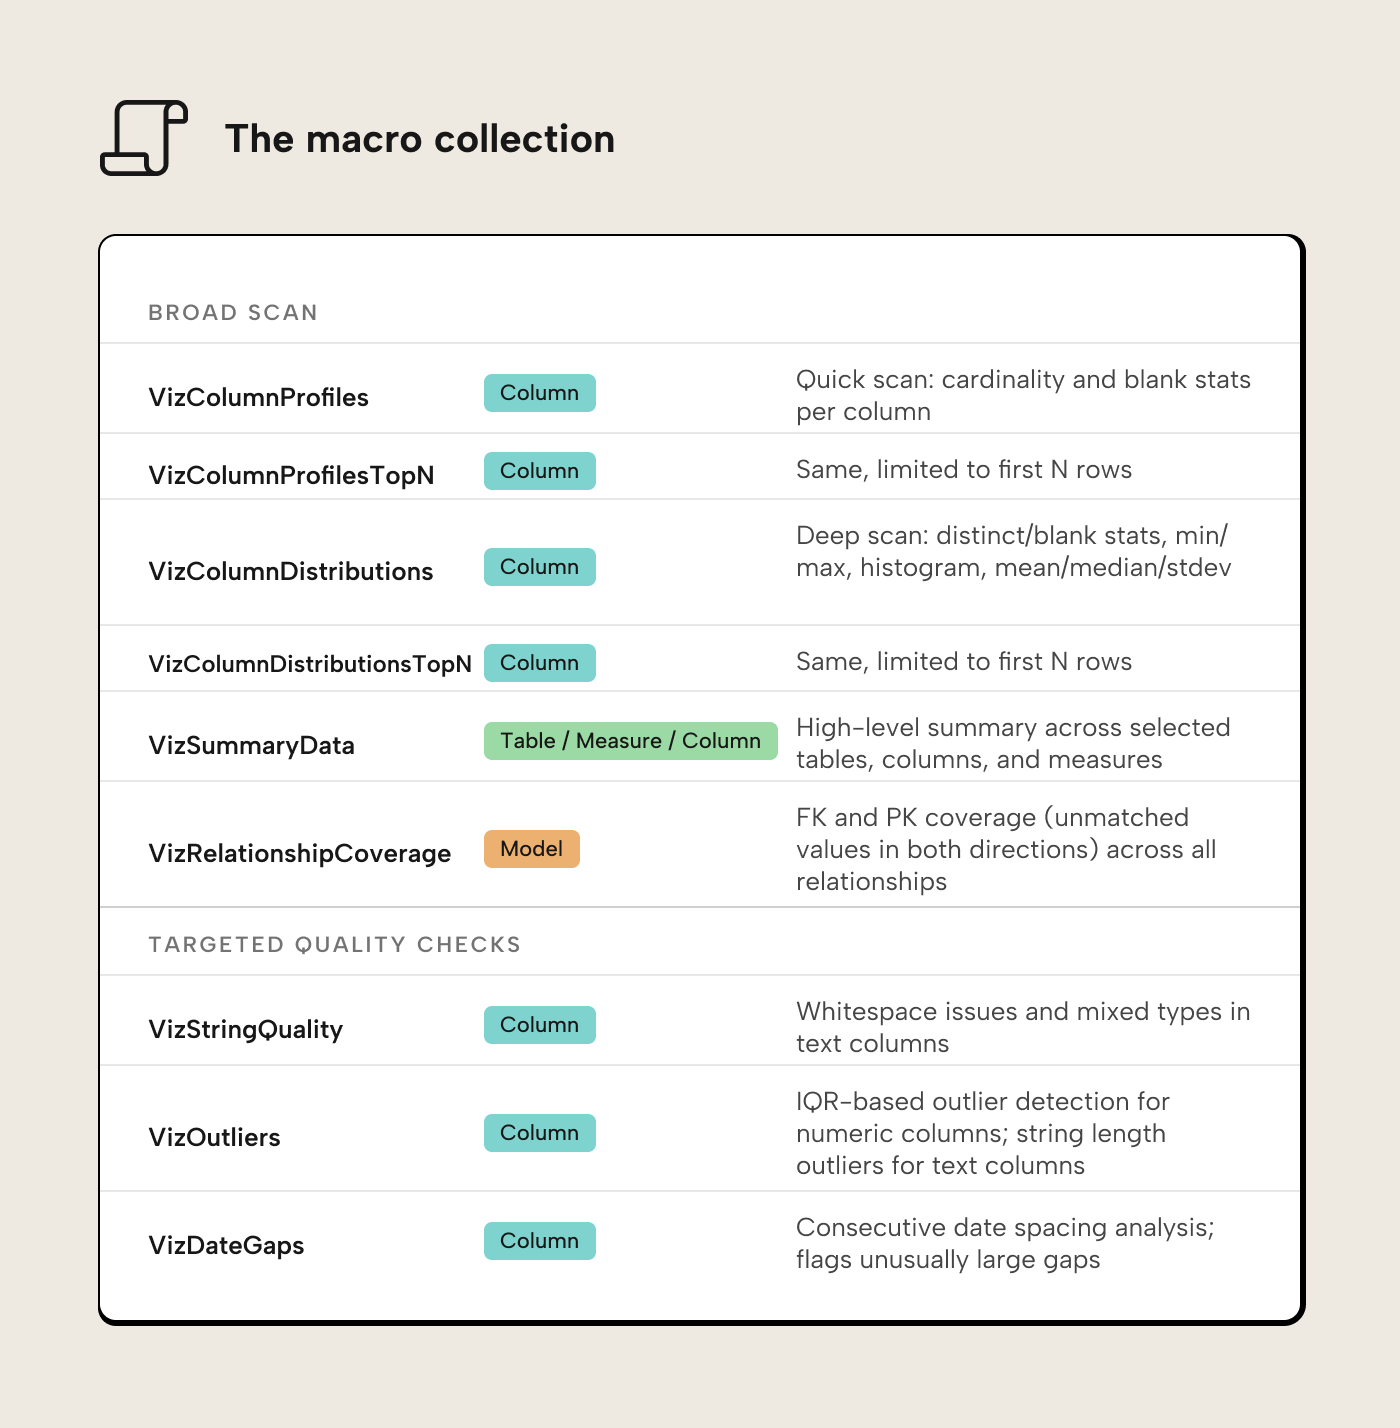
Installation instructions are in the Getting started section below.
Walkthrough: Profiling SpaceParts
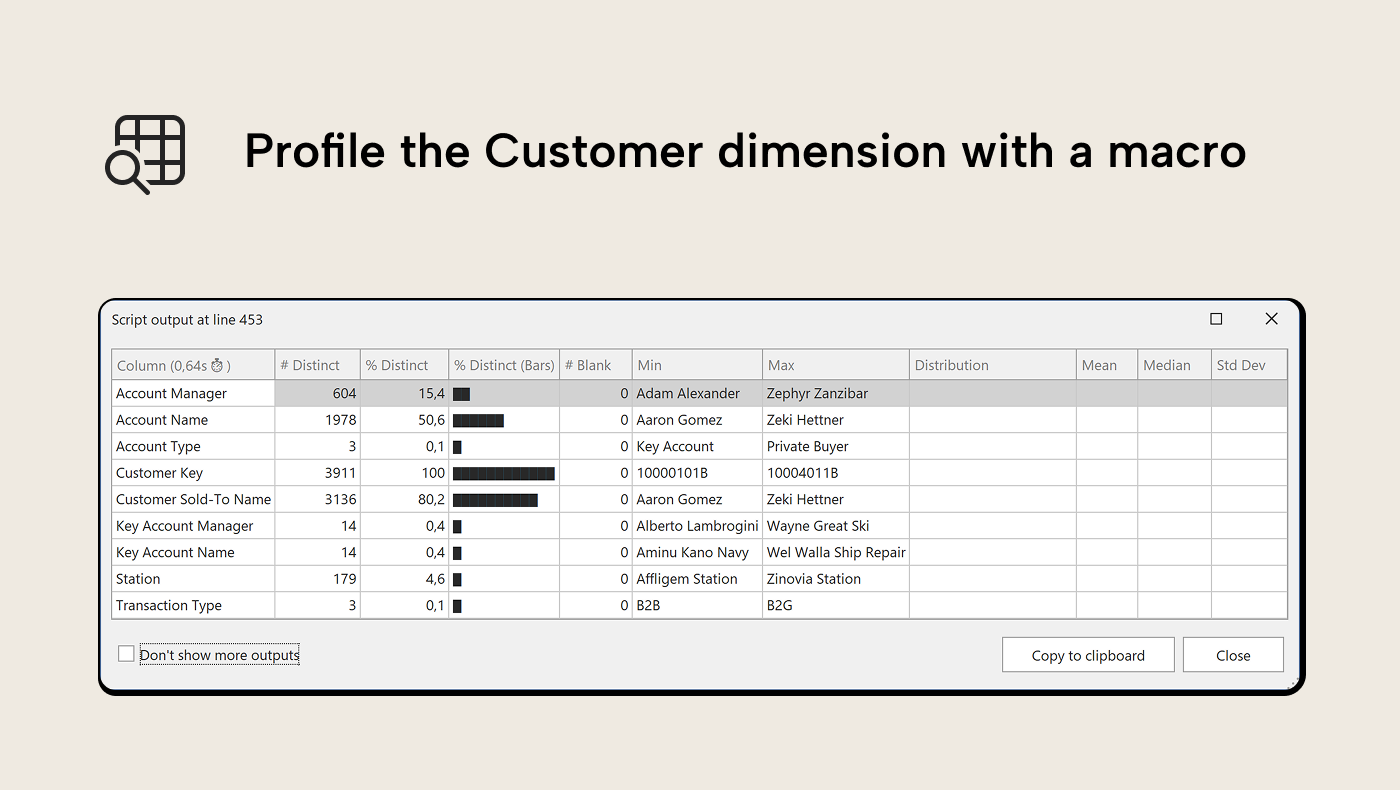
The walkthrough uses SpaceParts, our learning dataset. It contains data quality issues and gotchas, by design. Let’s start with a broad scan. Select all coumns from the Customers table in the TOM Explorer and run VizColumnDistributions. The output pane shows a data grid: one row per column, distinct counts, blank percentages with bar charts, min/max values, a 12-bin Unicode histogram for numeric and date columns and mean/median/standard deviation for numeric columns.
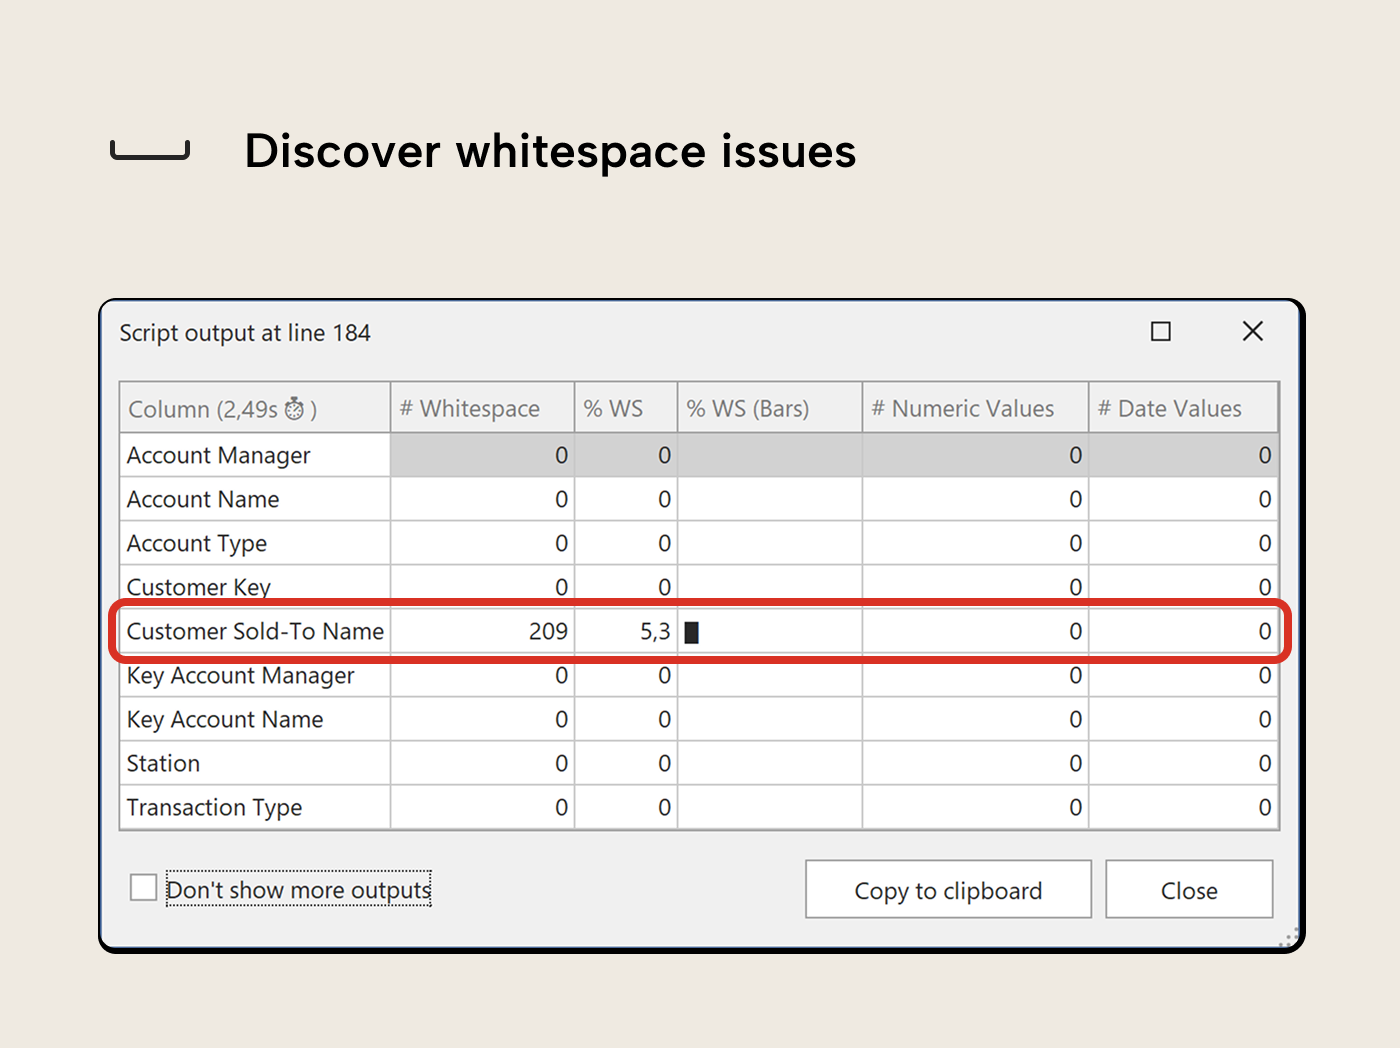
Now run VizStringQuality on the same selection, then on the Date table. Several columns flag:
- ‘Customers’[Customer Sold-To Name] reports whitespace issues; values that differ from their trimmed form, meaning leading or double spaces in what look like clean names. In a table browser they’re hard to notice; in DAX filter context, “ ACME Corp” and “ACME Corp” are two different values. Trailing spaces are automatically trimmed when loaded to a model, so they won’t surface as distinct values (nor does the macro check for them).
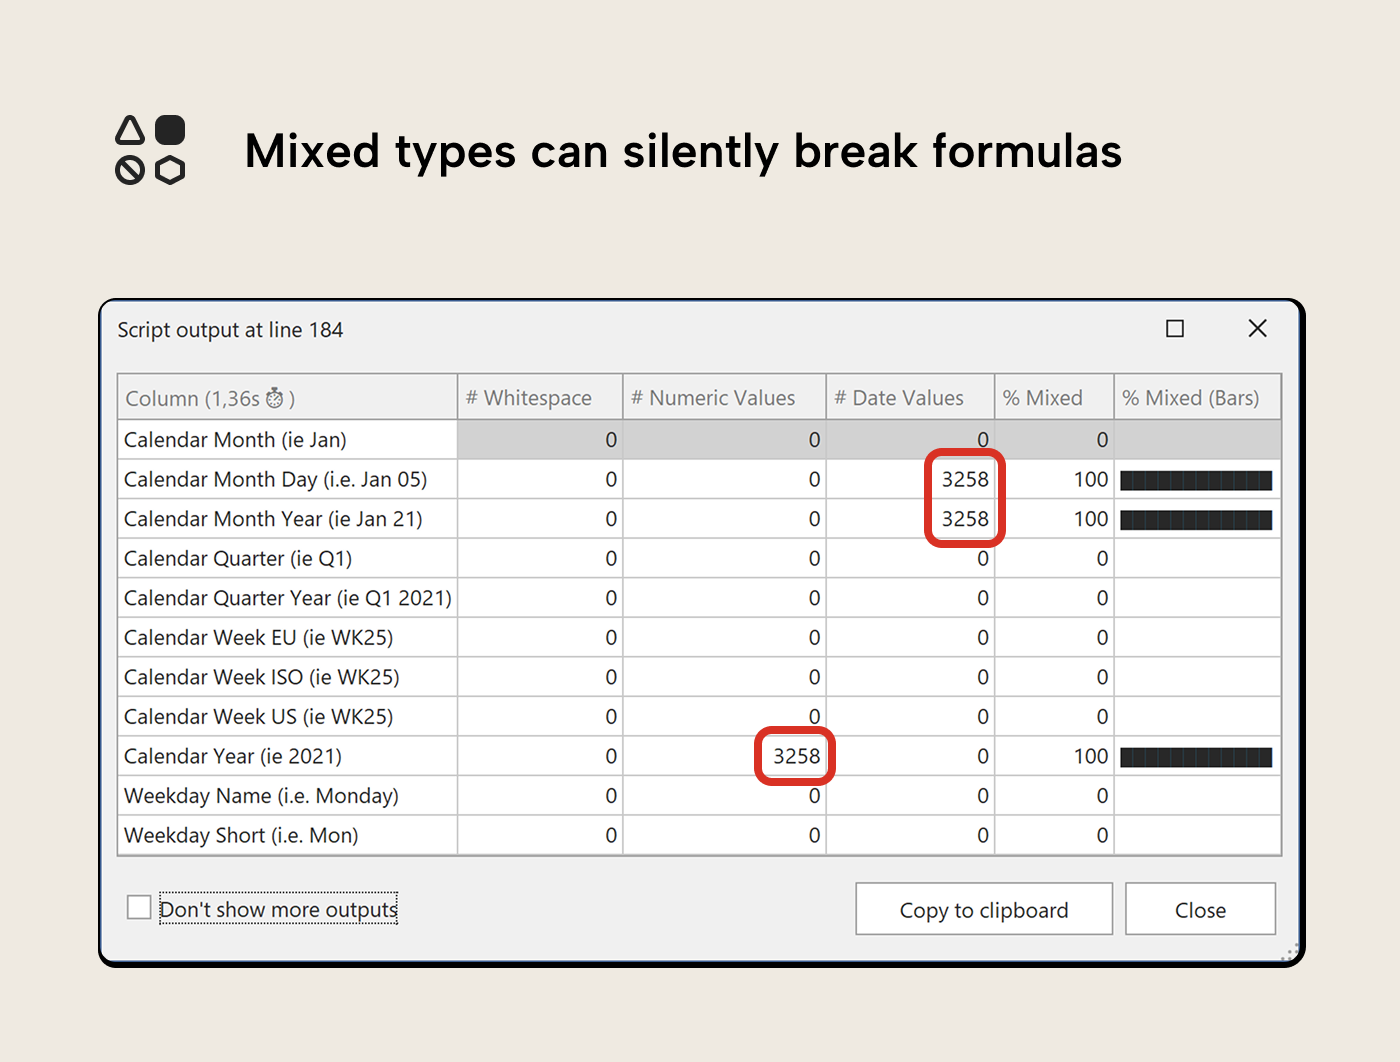
- The Date table’s helper text columns flag as mixed type: [Calendar Year (ie 2021)] has all 3,258 values parsing as numeric (year numbers stored as text), while [Calendar Month Day (i.e. Jan 05)] and [Calendar Month Year (ie Jan 21)] parse as dates. That’s expected for label columns, but useful to know if any downstream DAX treats them differently than intended.
VizStringQuality deliberately does not check for casing inconsistency (e.g. “SpaceParts” vs “SPACEPARTS”). VertiPaq’s default collation is case-insensitive: the engine collapses casing variants into a single value, so they never surface as duplicates in DAX or reports. The inconsistency may still exist in the source data, but VertiPaq masks it by keeping whichever form it encounters first.
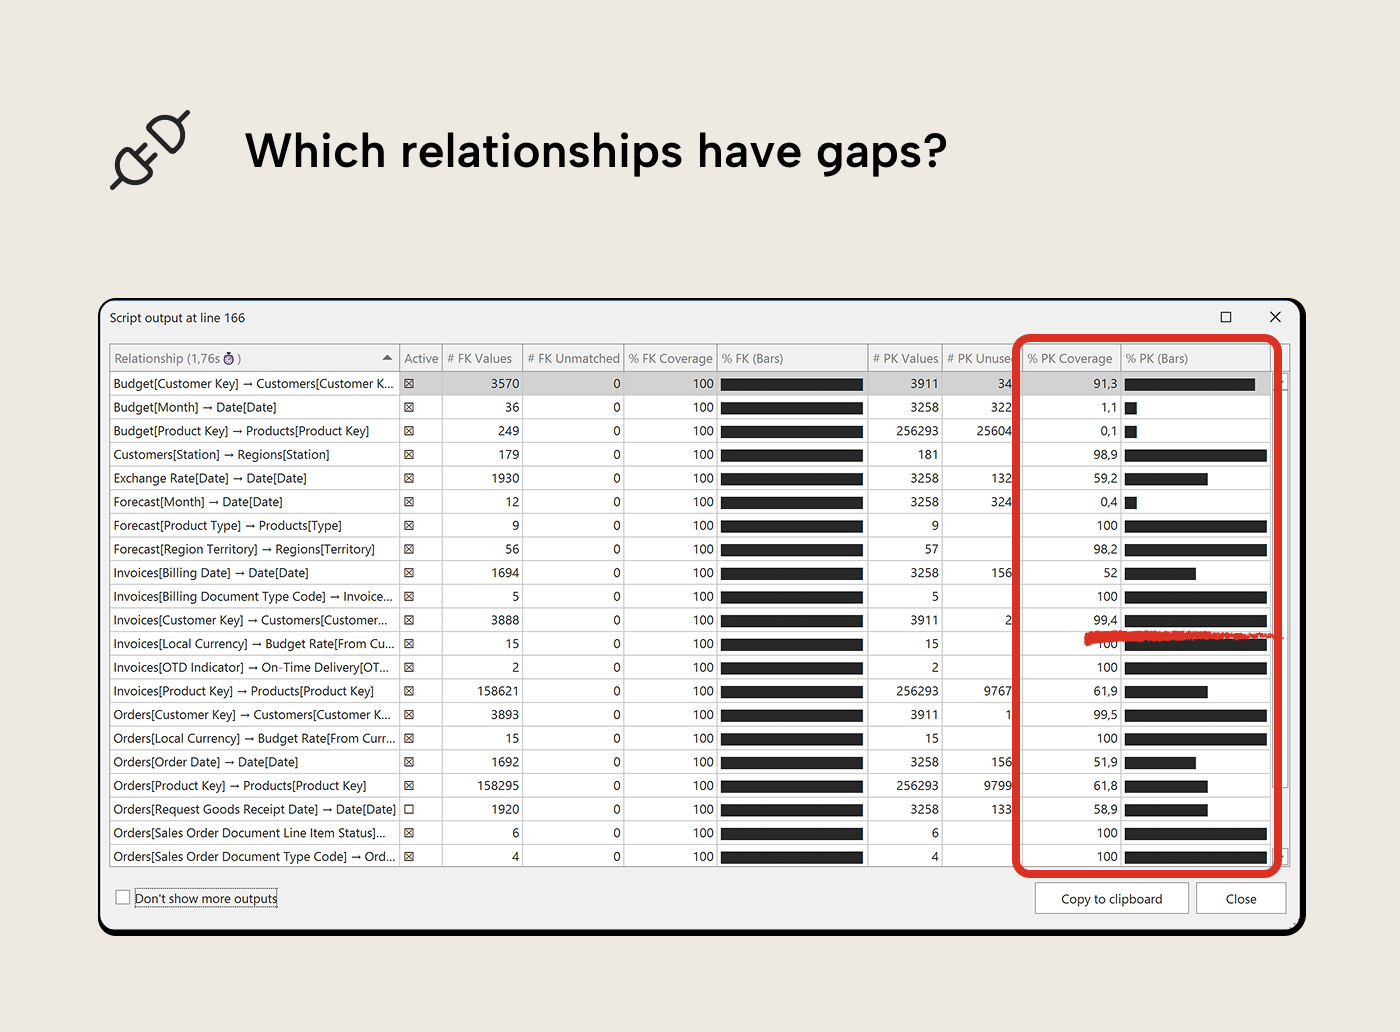
Now let’s switch to relationship coverage. VertiPaq Analyzer already tells you about referential integrity violations (Foreign Keys (FKs) in facts without a matching Primary Key (FK) in dimensions), but the VizRelationshipCoverage macro also shows the other side: PKs in dimensions that aren’t used by any fact tables as FK. It runs at the model level and iterates all relationships. In SpaceParts, the Invoices → Customers relationship shows a PK coverage drop: 23 customer keys in the Customer dimension table are unused in the Invoices fact table. That’s not necessarily a quality issue, but worth looking at.
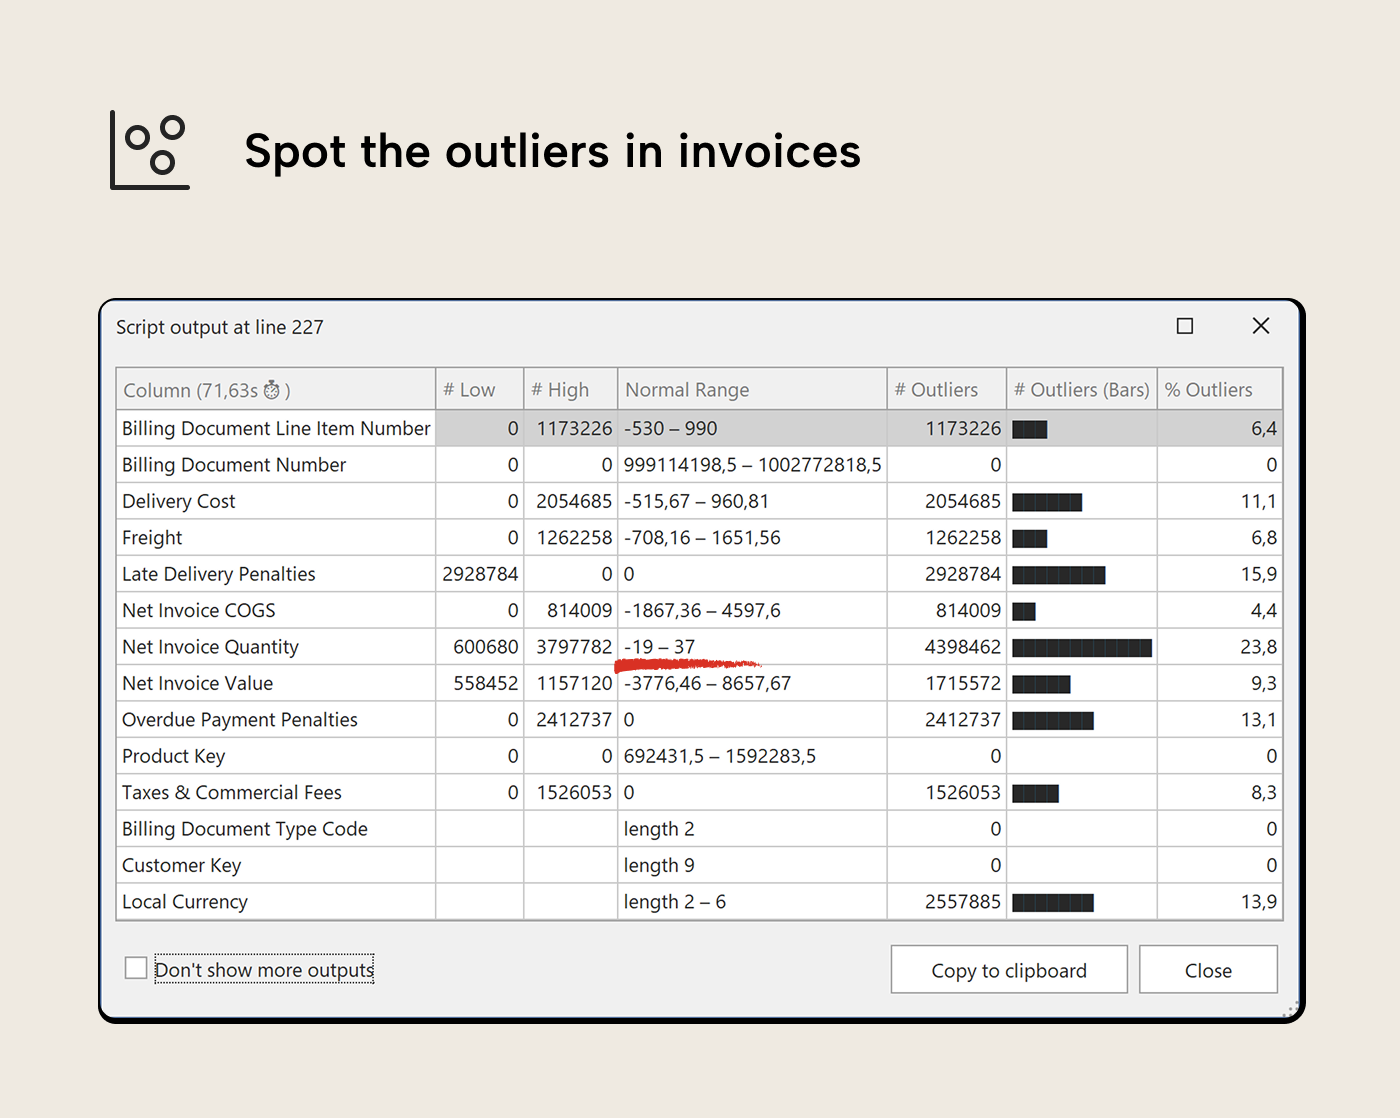
Then finish with outlier detection. Select the numeric columns from Invoices and run VizOutliers. [Net Invoice Quantity] shows low-value outliers; negative values. Are these returns, or something else? [Net Invoice Value] shows high-value outliers; a handful of rows that are well above the normal range. Whether those are legitimate large orders or data errors is now a specific question rather than a vague sense that something might be off.
Red flags to look for
Across any dataset, a few patterns tend to be worth a closer look:
- Blank percentages on key columns. Any blanks in a foreign key column mean fact rows with no link to the dimension; they resolve to the blank member and show as BLANK in report groupings. An order row with no customer key at all is worth investigating.
- Distinct counts that don’t match expectations. An [Order Status] column showing 15 distinct values when the business process defines 5 means something upstream is creating variants, often trailing spaces or encoding differences that look identical in a table browser but are distinct values in DAX.
- Distributions with suspicious extremes. A [Net Invoice Value] column where a single transaction is 100× the average deserves a look; it could be a legitimate large deal or a data entry error with an extra zero or misplaced decimal.
- Whitespace in dimension columns. “ACME Corp” and “ ACME Corp” with a leading space are two different customers in every slicer and filter. Reports split what should be one row into two, and users don’t see why.
- Low PK coverage on dimension tables. A ‘Customers’ dimension with 100,000 rows where only 3,000 have placed orders isn’t necessarily data error, but it inflates slicer lists and wastes memory. VizRelationshipCoverage shows both directions; unmatched fact keys and unused dimension members.
Phase 2: Investigating with the AI Assistant
The macro output inspires the prompt. Once you have a specific finding, open the AI Assistant from View → AI Assistant. It’s connected to the same model, so it can write and run DAX queries against the real data.
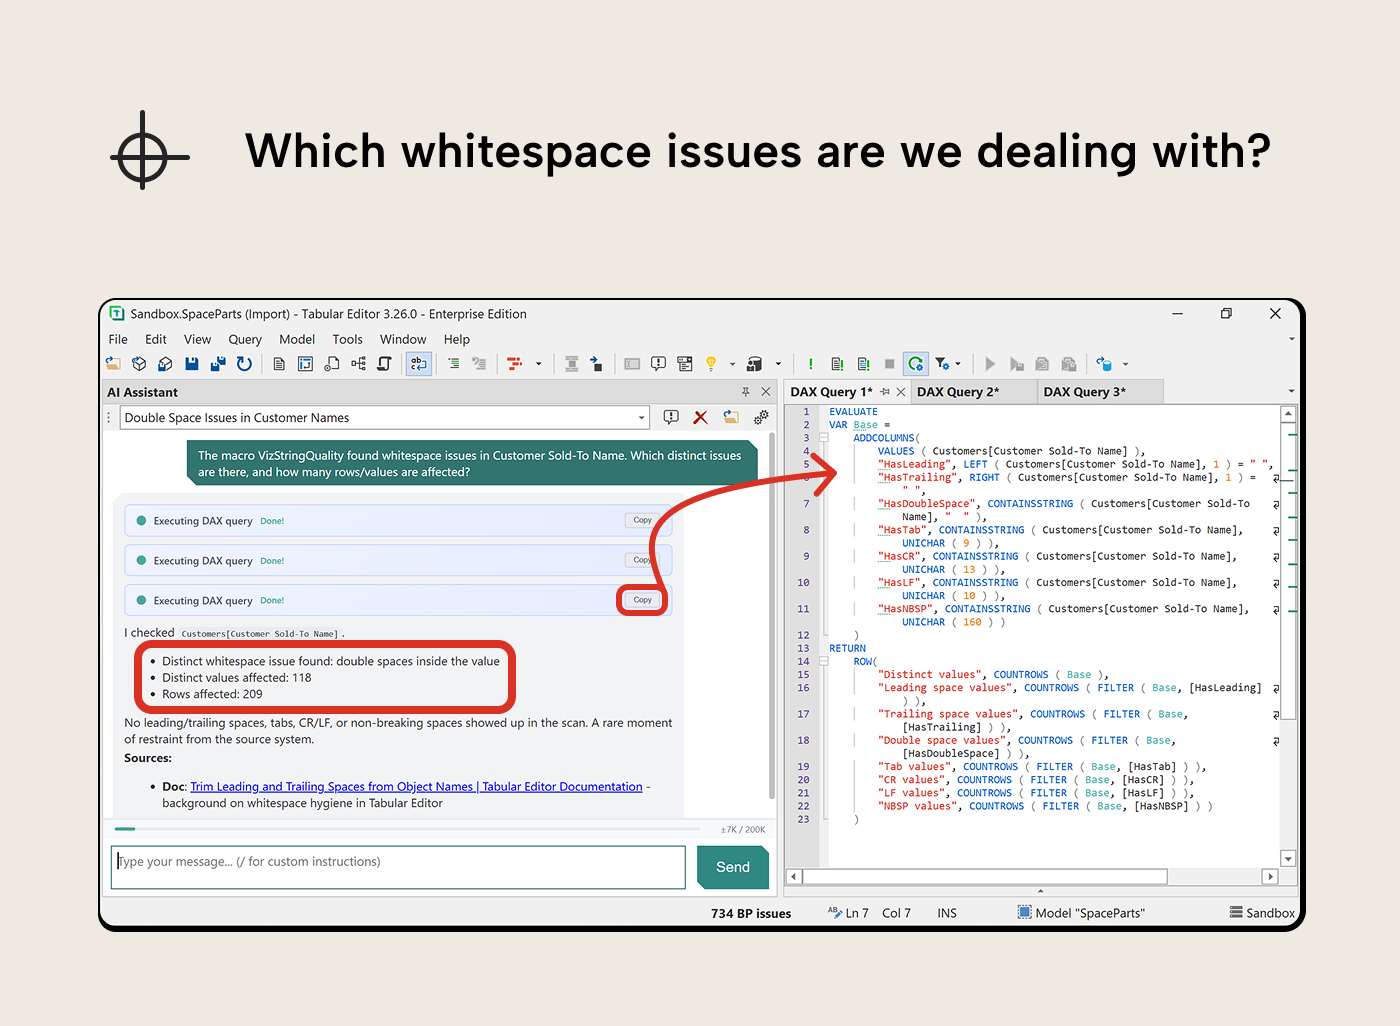
Following up on whitespace in Customer Sold-To Name
VizStringQuality flagged 209 rows with whitespace issues on Customer Sold-To Name, but the column looked clean in a quick browse. The macro told you how many; it didn’t tell you what kind of whitespace or which names are affected.
“The macro VizStringQuality found whitespace issues in Customer Sold-To Name. Which distinct issues are there, and how many rows/values are affected?”
The AI Assistant wrote a diagnostic query that broke the problem down by whitespace type: leading spaces, trailing spaces, double spaces, tabs, non-breaking spaces. That’s more useful than a flat list of names, because you now know what kind of cleanup is needed before looking at individual values. A follow-up prompt asking for the affected names gives you the specifics.
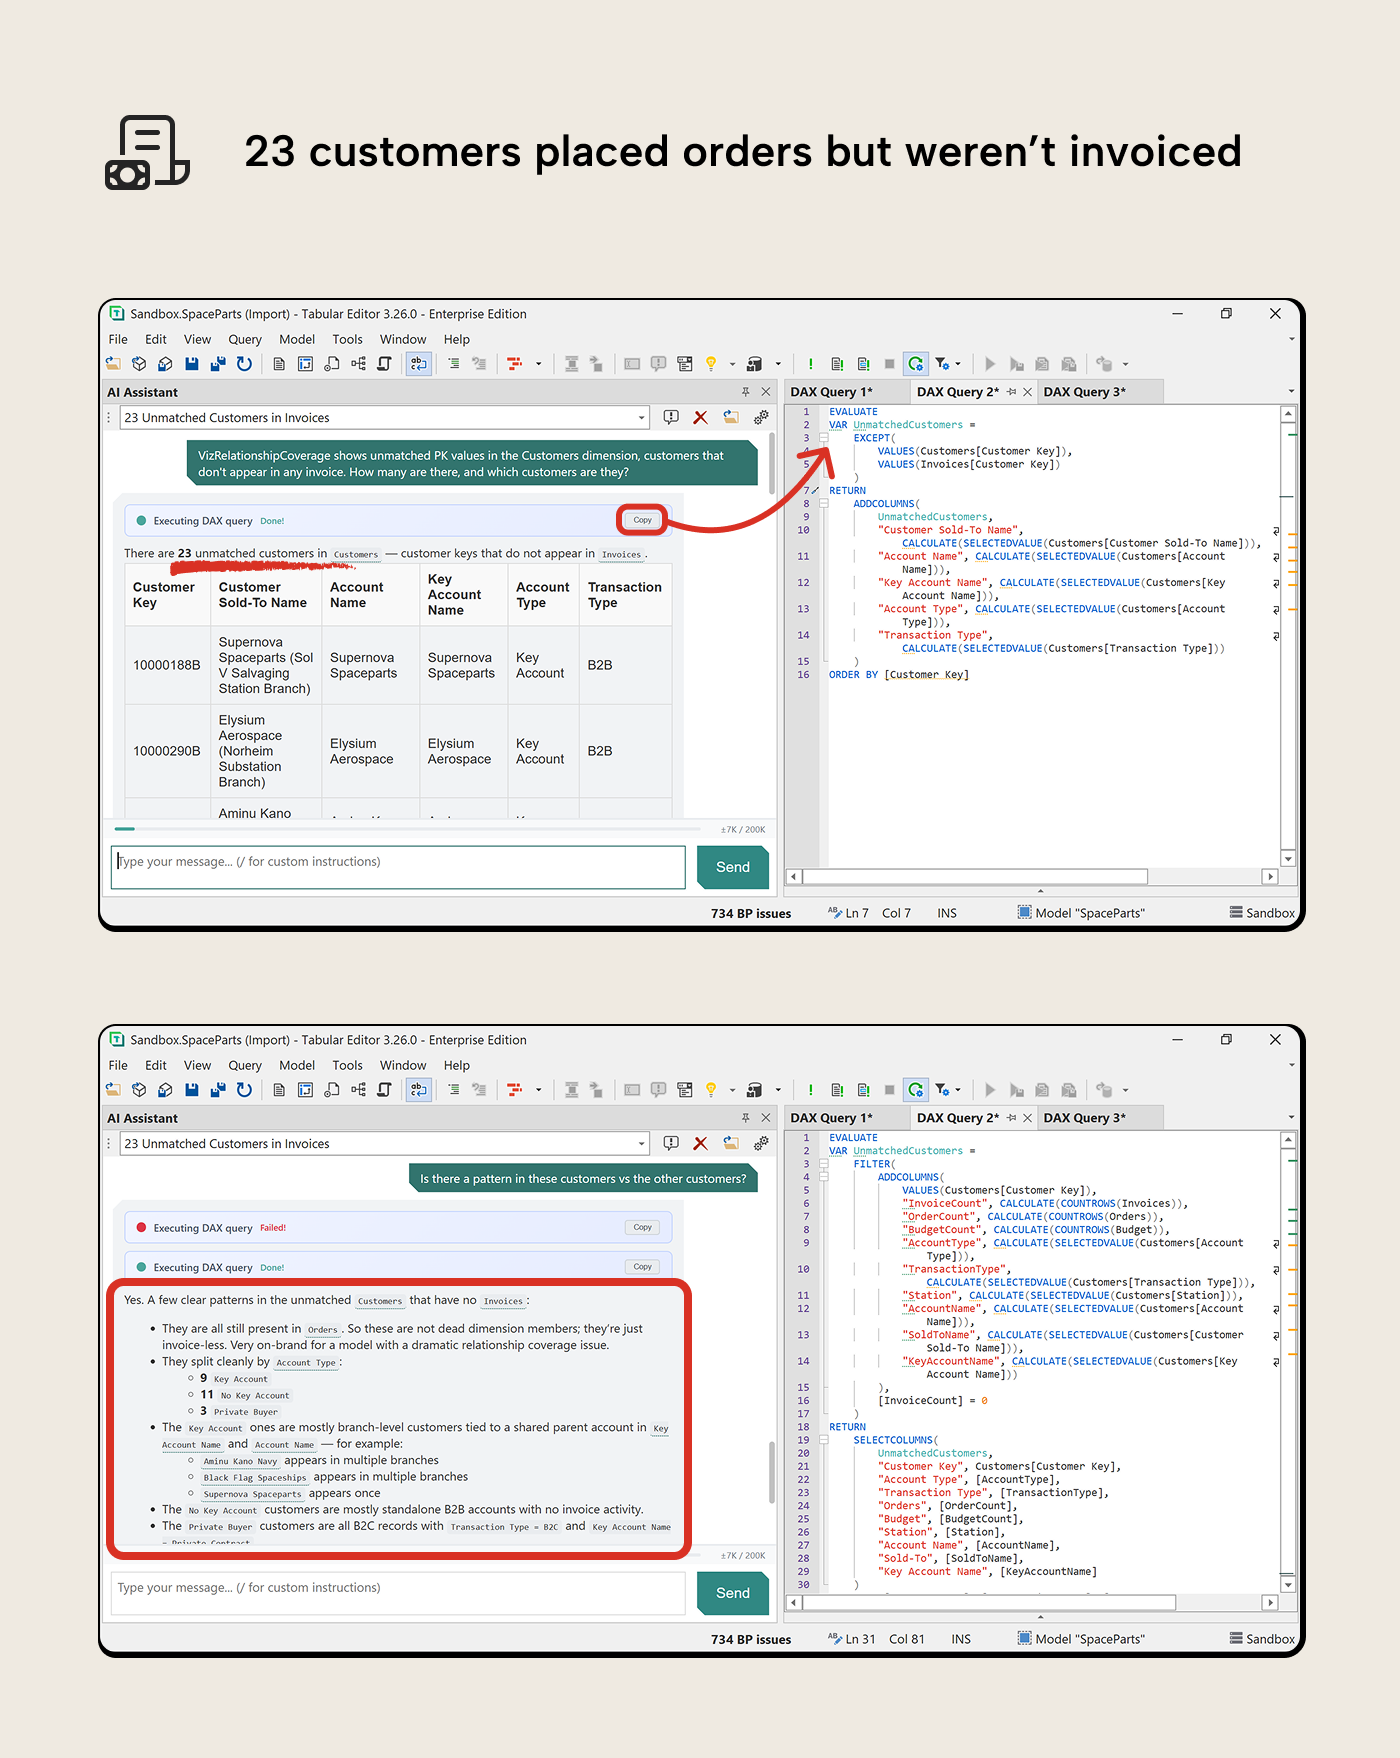
Following up on unused dimension members
VizRelationshipCoverage showed 23 customers in the Customers dimension that don’t appear in any invoice. The macro told you how many; it didn’t say which customers or why they’re there.
“VizRelationshipCoverage shows unused PK values in the Customers dimension, customers that don’t appear in any invoice. How many are there, and which customers are they?”
The AI Assistant wrote a query listing the 23 unused customers with their attributes. A follow-up revealed they all still appear in Orders; these are real customers with order history who were never invoiced. Whether that’s a normal business state (pending invoicing) or a process gap depends on the domain, but without looking you’d never know they were there.
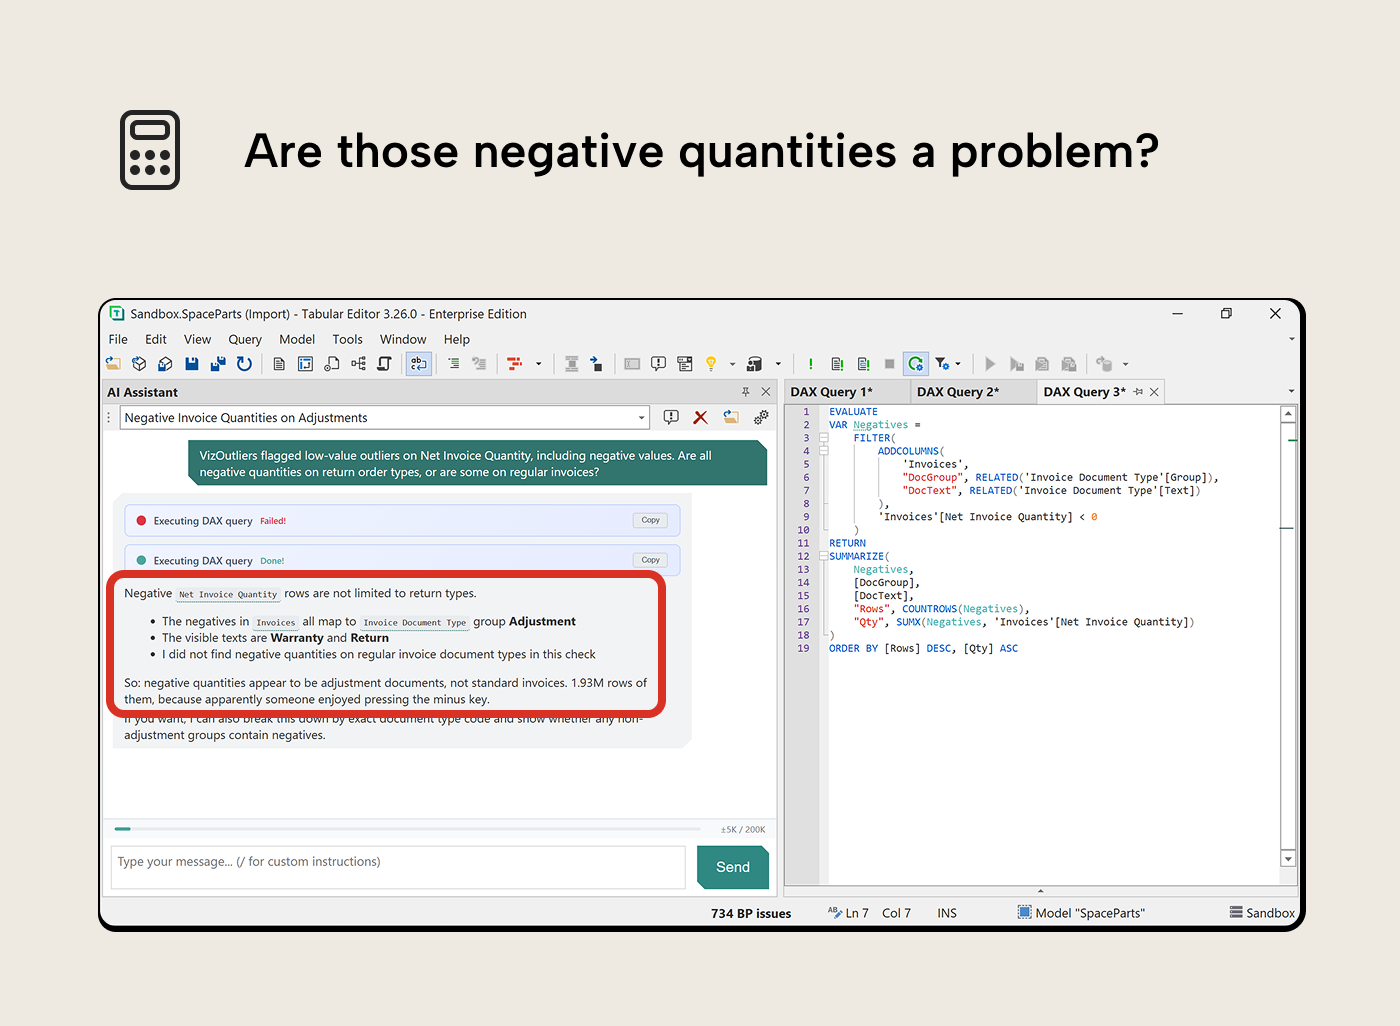
Following up on negative quantities
VizOutliers flagged negative values on Net Invoice Quantity. 1.93 million rows of them. The macro counted the outliers; it didn’t say whether they’re legitimate adjustments or data entry mistakes.
“VizOutliers flagged low-value outliers on Net Invoice Quantity, including negative values. Are all negative quantities on return order types, or are some on regular invoices?”
The AI Assistant broke this down by document type group. All negative quantities mapped to the Adjustment group (Warranty and Return document types); no regular invoices had negatives. That’s expected business logic, not a data quality issue. But 1.93 million adjustment rows is a lot; it’s worth understanding whether measures that sum quantity handle them correctly or whether they should be filtered out in certain contexts.
Getting started
Each macro is a standard Tabular Editor C# script. It builds DAX queries, runs them via EvaluateDax(), and renders the results in TE3’s output pane. No external dependencies, no file output. The scripts use newer C# features that require the Roslyn compiler, standard in TE3, but TE2 users need to manually enable it. The scripts and their DAX are readable. If you want to adapt them, they’re on GitHub.
Installing the macros
Download the .csx files from the VizDataTableOutput folder on GitHub\
- In TE3, File → New C\# Script → Paste the script contents → Save as Macro
- Set the macro context (Column, Table, or no context) as noted in each script’s header comments
The macros with Column context appear in the right-click menu when you select columns in TOM Explorer. VizRelationshipCoverage runs at the model level. Optionally, assign keyboard shortcuts in Preferences → Keyboard Bindings.
Enabling the AI Assistant
The AI Assistant is available in Tabular Editor 3 as of the March 2026 release. If installed, open it from View → AI Assistant and configure your API key under Preferences → AI Assistant. The AI Assistant documentation covers setup in detail.
First run
Select any table’s columns in TOM Explorer, run VizColumnProfiles for a quick overview, then VizColumnDistributions for the full picture. If a column looks unexpected, open the AI Assistant and describe what you want to know. The macro surfaces the what; the assistant helps with the why.
Further Reading
- Prepare your data for a semantic model (Tabular Editor). This article covers the upstream data preparation work that makes profiling more effective before modeling begins.
- AI Assistant documentation (Tabular Editor Docs). The setup guide covers how to configure the assistant used to investigate macro findings.
- VizDataTableOutput macros on GitHub (GitHub). The repository contains the data profiling macro collection and installation instructions.
- Tabular Editor 3 C# scripting documentation (Tabular Editor Docs). Use the scripting reference when adapting the macros, including calls such as
EvaluateDax()andDataTable.Output().
In conclusion
Catching data quality issues upstream, before the model is built, is the right approach. The macros and AI Assistant don’t replace that work. What they do is make it practical to ask the same questions from inside the model, for the cases where issues slipped through, or the data arrived without a track record.
There’s no magic button; you still have to know what you’re looking at and decide whether it matters. But the friction of getting a first scan is low, the output lands in the same window you’re already working in, and when something flags, the AI Assistant is one prompt away.
Profile model data inside Tabular Editor 3 before small issues spread.
Give Tabular Editor a spin