Key takeaways
- The Tabular Editor CLI is in Limited Public Preview: A cross-platform command-line interface for semantic models on Windows, macOS, and Linux, free to evaluate until the preview ends on September 30, 2026. Download it here.
- Built for three audiences: Humans scripting advanced workflows, AI agents doing token-lean modeling, and CI/CD pipelines, all served by structured JSON output and a non-interactive mode.
- Over 50 commands across the lifecycle: Inspect, edit, validate, deploy, refresh, and test models from your terminal, against Power BI Desktop, local TMDL/BIM files, or deployed models.
- Backwards compatible with the TE2 CLI: Existing pipelines using TE2 CLI syntax keep working, giving teams a gradual path onto the new command shape.
- An interactive mode for newcomers: Guided prompts for authentication, workspace selection, and model exploration offer a gentler on-ramp than writing flags from scratch.
Introducing the Tabular Editor CLI
We are happy to launch the Limited Public Preview of the Tabular Editor CLI, a cross-platform command-line interface that gives humans, AI agents, and CI/CD pipelines headless access to Tabular Editor features. In practice, that means driving Tabular Editor by typing commands instead of clicking through the app. That may sound like extra work for a one-off edit, and it is. The payoff comes when the task repeats: a command is text, so you can save it, version it, and run it again later or unattended, while a click in a dialog does the job once and is gone. Whether you want to script bulk edits across dozens of models, let a coding agent work on your semantic model directly, or automate deployments in your build pipeline: the TE CLI is built for it, on Windows, macOS, and Linux.
NOTE
The TE CLI is in limited public preview and offered for evaluation with a Tabular Editor account. We recommend against using the CLI in production CI/CD pipelines during preview, as commands, flags, and outputs may change before general availability. The preview build will stop functioning after September 30, 2026. After the preview period, a license will be required. We welcome your feedback.
Built for humans, agents, and pipelines
Three audiences, shared primitives. The same design choices that make the TE CLI human-friendly also make it agent-friendly, script-friendly, and pipeline-friendly.
- Structured output on every command. Pass
--output-format json(or csv, where it makes sense) and any command returns machine-parseable data instead of human-formatted text. Humans scripting bulk operations, agents consuming results, and CI pipelines checking for deploy success all read the same shape. - Non-interactive mode. The
--non-interactiveglobal flag disables every prompt: confirmations, guided wizards, credential picklists. The CLI either proceeds or fails with an actionable error telling you exactly what’s missing. Essential for unattended pipelines and agents; safe to ignore when you’re working interactively. - Clear error messages. When a flag is missing, a model path is wrong, or a deploy fails its BPA gate, the error tells you what went wrong and what to try next. Error messages are designed to be useful to both humans scanning a terminal and agents reading stderr (the standard error stream machines use for diagnostic output).
- Composability. Output redirects, commands chain, structured data flows downstream. The CLI becomes a building block rather than a black box.
te connect Sandbox MyModel
te refresh --type full --dry-run > refresh.tmsl
cat refresh.tmsl
In a pipeline
Three te commands chained with && make a CI step: a custom pre-deploy script written in C#, a deploy that writes a TMSL preview to a file instead of pushing, and a check that the preview landed.
The same chain in a GitHub Actions workflow YAML:
# .github/workflows/deploy-semantic-model.yml
name: Deploy semantic model
on:
push:
branches: [main]
jobs:
  deploy:
    runs-on: ubuntu-latest
    env:
      AZURE_TENANT_ID:     ${{ secrets.AZURE_TENANT_ID }}
      AZURE_CLIENT_ID:     ${{ secrets.AZURE_CLIENT_ID }}
      AZURE_CLIENT_SECRET: ${{ secrets.AZURE_CLIENT_SECRET }}
    steps:
      - uses: actions/checkout@v4
      - name: BPA gate
        run: te bpa run ./SpaceParts.SemanticModel --fail-on error --ci github --auth env
      - name: Pre-deploy custom checks
        run: te script ./SpaceParts.SemanticModel --script ./pre-deploy-checks.cs --auth env
      - name: Generate TMSL preview
        # Replace -s and -d values with your workspace and model names
        run: te deploy ./SpaceParts.SemanticModel -s Production -d SpaceParts --xmla preview.xmla --skip-bpa --force --auth env
      - uses: actions/upload-artifact@v4
        with:
          name: tmsl-preview
          path: preview.xmla
Going from a prompt to a pipeline takes one flag: --auth env reads service-principal credentials from the standard Azure environment variables. The chain is otherwise identical.
For AI agents
Coding agents can interact directly with semantic models through the TE CLI: structured JSON output, --non-interactive mode, and clear error messages give them the same commands a human developer uses by hand.
NOTE
We developed a skill for AI coding agents that wraps the TE CLI end-to-end. We highly appreciate your input and feedback; feel free to leave a reaction at the bottom of this blog, open an issue if you run into trouble, or just start a discussion.
Backwards compatible with the TE2 CLI
If you have CI/CD pipelines built on the TE2 CLI, your existing scripts work. The TE CLI supports TE2 CLI syntax alongside the new command structure, so you can migrate gradually rather than cut over in one go. Run te migrate for a side-by-side reference of every TE2 CLI flag and its TE CLI equivalent, useful when rewriting an existing pipeline or reading one somebody else wrote.
What the TE CLI can do
Most of what you do in Tabular Editor 3 (loading a model, editing its objects, analyzing storage, running the Best Practice Analyzer, deploying to a workspace, triggering a refresh) now has a CLI equivalent. Over 50 commands are organized into 10 families:
| Family | What it does | Example commands |
|---|---|---|
| Model I/O | Load, save, export, create new models | te load, te save, te init |
| Model Editing | Get/set properties, add/remove/move objects | te set, te add, te rm, te mv |
| Inspection | List objects, search, diff, dependency analysis | te ls, te find, te diff |
| Analysis & Quality | Validate, run BPA, format DAX, analyze storage | te validate, te bpa run, te vertipaq |
| Execution | Run DAX queries, C# scripts, macros | te query, te script |
| Deployment & Refresh | Deploy to workspace, trigger refresh, incremental refresh | te deploy, te refresh |
| Testing | Assertion tests, snapshots, A/B comparison | te test run |
| Connection & Auth | Connect to workspaces, manage auth & profiles | te connect, te auth |
| Shell | Interactive mode, shell completions | te interactive, te completion |
The rest of this post walks through the most useful commands in action.
Connecting to a model
Before running any commands, point the CLI at a model. For local files, pass the path directly. For a model deployed to Fabric, use te connect:
te connect Sandbox SpaceParts: connection summary showing workspace, model name, compatibility level, size, last processed and number of tables/relationships/roles.
TIP
Every command prints a yellow banner by default. To quiet it down, run te config set hidePreviewNotice true once and future commands will drop the preamble. Fair warning: you can hide the notice, but the preview still expires on September 30, 2026.
The CLI remembers the active connection for the rest of your terminal session. Commands like te ls, te bpa run, and te query use it automatically without needing to repeat -s and -d each time.
Inspecting and searching your model
The first thing most people do with a new CLI is look around. te ls prints a summary of your model and lists its tables, their column counts, and their measure counts at a glance.
te ls on SpaceParts returns colorized header banner with object counts (29 tables, 136 measures, 210 columns, 22 relationships, 8 roles, 7 calc groups), table of tables with column/measure counts, hidden tables dimmed.
te find searches across names, DAX expressions, descriptions, display folders, format strings, and annotations. Useful before renaming a column, for instance, when you want to know exactly which measures reference it:
te find "SUM" --in expressions: 27 matches on SpaceParts, table with Path / Type / Property / Match / Line columns.
te get returns the value of any property on any object. For measures, the -q expression flag returns the DAX expression rendered with syntax highlighting:
te get "Invoices/MTD Gross Sales": multi-line DAX with VAR, CALCULATE, IN, FILTER colored as keywords, string literals in red, variables distinct.
For measures, you can skip the path entirely. Because measure names are unique across a model, te get "[MTD Gross Sales]", or just get [MTD Gross Sales] in interactive mode, resolves to the same measure. Tables take quotes (te get "'Invoices'"), and full DAX syntax works too: te get "'Global Measures'[Running Total Sets]", just as you could (but needn’t) fully qualify a measure in DAX.
The object-path syntax is consistent across te get, te set, te add, te rm, and te mv. Table for a table, Table/Measure for a measure, Table/Column for a column. Learn it once, use it everywhere.
Formatting and bulk-editing DAX
te format formats a DAX expression. For a single expression, pass it inline with -e, and the formatter also validates and reports parse errors with precise line and column numbers:
te format -e "SUMX(Invoices Invoices[Net Invoice Value]*Invoices[Quantity]),": formatted output, then the same with a deliberate typo → Error: Line 0, Col 66: Syntax error, expected: ), +, -, *, /,…
Across a whole model, te format --save formats expressions in place and writes the result back, either to local files or a connected server. Here the formatter cleans up the jumbled expression on MTD Gross Sales and saves to the model:
te get "Invoices/MTD Gross Sales" then te format -p "Invoices/MTD Gross Sales" --save: shows unformatted DAX first, then formatted DAX and saved to server.
For object renames like measures, tables and columns, prefer te mv. It renames the object and updates every DAX reference to it across the model in one pass, the same propagation as Tabular Editor 3.
For text-level bulk edits like string literals, descriptions, or patterns that span multiple object kinds, te replace does find-and-replace with a --dry-run preview:
te replace "Freight Surcharge" "Freight Fee" --in expressions --dry-run: before/after pairs across multiple measures
Running C# scripts
te script runs a C# script against the model. Scripts access the Tabular Object Model (TOM), so they can iterate the model’s tables, columns, measures, hierarchies, roles, and perspectives, read their properties, and make changes.
You can pass an expression inline with -e, or a .cs or .csx file with --script. For example, set Sort By Column on the date table so month name sorts by month number, weekday by weekday number, and so on:
var date = Model.Tables["Date"];
var columns = new Dictionary<string, string>
{
    { "Calendar Month (ie Jan)",         "Calendar Month # (ie 1)" },
    { "Calendar Month Year (ie Jan 21)", "Calendar Year Month (ie 202101)" },
    { "Weekday Name (i.e. Monday)",      "Weekday Number EU (i.e. 1)" }
};
foreach (var pair in columns)
{
    date.Columns[pair.Key].SortByColumn = date.Columns[pair.Value];
}
Console.WriteLine($"Set SortByColumn on {columns.Count} columns of Date.");
te script --script print-measure-description-length.cs: prints measures and their description lengths. te script --script set-date-sort.cs --save: prints Sort By Column properties that were set, and shows changes pushed and saved to server.
Because te load and te save are separate commands, a script runs between them without caring where the model came from. You can chain them together however you want: load, script, save; load, script, deploy; or some other combination. If you’ve worked with C# scripts in the Tabular Editor 2 CLI, you’ll recognize the workflow.
Running the Best Practice Analyzer
te bpa run evaluates your model against BPA rules and reports violations. It is the same Best Practice Analyzer from Tabular Editor 3 desktop, now in the terminal:
te bpa run against the live Sandbox/SpaceParts connection: color-coded severity column (Error in red), clean violation table with Severity / Rule / Object / Type.
Add --fix to auto-fix violations that have fix expressions, and --save to persist those fixes. Add --ci github and the CLI emits GitHub Actions annotations, so BPA violations surface as inline annotations in your pull request rather than buried in a log. Azure DevOps users substitute --ci vsts.
BPA also runs automatically as a gate on te deploy and te save. If a deploy fails with a message like BPA gate: “3 violation(s) at severity >= error”, the CLI tells you what the options to proceed are: fix manually, add --fix-bpa to auto-fix, or add --skip-bpa to bypass.
te validate complements BPA with compiler-level DAX checks: unsafe divisions (/ instead of DIVIDE), unused variables, context transition mistakes, etc. Every warning has a code like DAX0103 and, where the fix is obvious, an inline suggestion. Same --ci github/--ci vsts CI integration as te bpa run, plus --trx for VSTEST result files.
Analyzing storage
te vertipaq surfaces the same per-table and per-column storage statistics that the Vertipaq Analyzer pane shows in Tabular Editor 3 desktop: compressed size, cardinality, dictionary size, and more.
te vertipaq --all against live SpaceParts: returns model header banner (Size 1020.8 MB, Tables 29, Max Rows 18.5M), per-table breakdown with Rows / Size / Cols / % and a visual bar chart inline in the terminal.
This is the command to reach for when a model is bigger than expected and you need to know why; which columns are consuming memory, which tables dominate, where to look first for compression opportunities. The inline bar chart makes the Pareto distribution of storage obvious at a glance. Add --export stats.vpax to save the full Vertipaq Analyzer dataset to a .vpax file, compatible with DAX Studio, DAX Optimizer, and other external tools.
Executing DAX queries
te query runs any DAX query against a deployed model and returns the result as a table, CSV, or JSON:
te query -q "EVALUATE TOPN(10, 'Brands')": the query rendered in a syntax-highlighted box at the top, Validating query... indicator, result table with all columns, 10 rows in 100ms footer.
This is the CLI building block that unlocks many workflows: spot-checking a measure after a deploy, extracting data for an ad-hoc analysis, feeding results to a downstream tool or an AI agent. The --output-format json flag returns structured data instead of formatted text.
Deploying
te deploy publishes a semantic model to a Fabric / Power BI workspace, or over XMLA to a local SQL Server Analysis Services instance (Windows only) or Azure Analysis Services. By default, it runs BPA as a gate, shows you a summary of what will be deployed, and prompts for confirmation before making any changes:
te deploy ./model -s Sandbox -d DeepReach: three frames: 1. BPA gate blocks: “75 violation(s) at severity >= error” 2. Retry with --skip-bpa:, then interactive prompt Deploy? [y/n] (n): with safe-default n 3. Type y, short pause, Deployed successfully.
Two defaults are worth highlighting. BPA runs before every deploy, and interactive confirmation is required, with n as the default answer, not y. When BPA blocks a deploy, --skip-bpa deploys anyway, the right tool when the local source and the deployed model should stay in sync even with known violations.
For CI pipelines, use te deploy ./model --force --ci github. --force skips the interactive prompt; --ci github emits logging commands that GitHub Actions renders as deploy logs and failure annotations.
NOTE
te deploy can also emit the XMLA/TMSL script without deploying, with te deploy ./model --xmla deploy.tmsl. This is useful for reviewing exactly what will be pushed, or for handing the script to a DBA who will apply it manually.
Refreshing data
te refresh triggers a data refresh on a deployed model. You can refresh the whole model, a single table, or a specific partition:
te refresh --table Regions --type full: live spinner, sped up for demo purposes | Refreshing Regions (181 rows, reading)..., then a summary table with Rows / Query / Read / Total / Rows/s, followed by per-table bottleneck analysis (MashupCPU (625ms) ~ ReadRows (0ms): Power Query evaluation is the bottleneck, not data transfer) and throughput classification (147M rows/s, excellent).
The CLI surfaces the same refresh diagnostics that Tabular Editor 3 desktop shows in its refresh log: throughput per table, Power Query bottlenecks, memory usage patterns. When a refresh is slow, you see exactly where the time is going.
Add --dry-run to any refresh command to see the TMSL script the CLI would send, without executing it. Pipe it to a file with te refresh --type full --dry-run > refresh.tmsl and you have a version-controllable refresh artifact. Incremental refresh policies are supported through te incremental-refresh (show, set, rm, apply), and partition-level refresh is one flag away with te refresh --partition <Table.Partition>.
Testing your model
The TE CLI includes a regression-testing framework for semantic models. You write assertions against measure values (“Gross Sales should be above zero,” “Regions should have at least 10 rows”) and te test run executes them against a deployed model:
te test run against a small hand-crafted suite: three bright-green PASS lines with actual values displayed inline (Gross Sales is positive -> 212.672.491.722,12) and one red FAIL (Customer count matches FY25 baseline -> Expected 2000, got 1978), summary 3 passed, 1 failed in 4s.
Use it for CI pipelines that fail a build when key measures drift, for pre-deploy smoke tests, or to A/B compare calculation results between a staging model and production.
TIP
te test init --from-model --model ./my-model generates stubs from your model’s measures, as a starting point for writing your own assertions. Replace the generated placeholder values with your expected baselines.
Interactive mode
If you’re new to command lines, the TE CLI has a guided mode. Run te interactive to enter a session, then connect; in interactive mode this brings up a connection picker for a local or remote instance, or one of your saved profiles. Commands are shorter inside the session, and a model-aware prompt shows you exactly where you are:
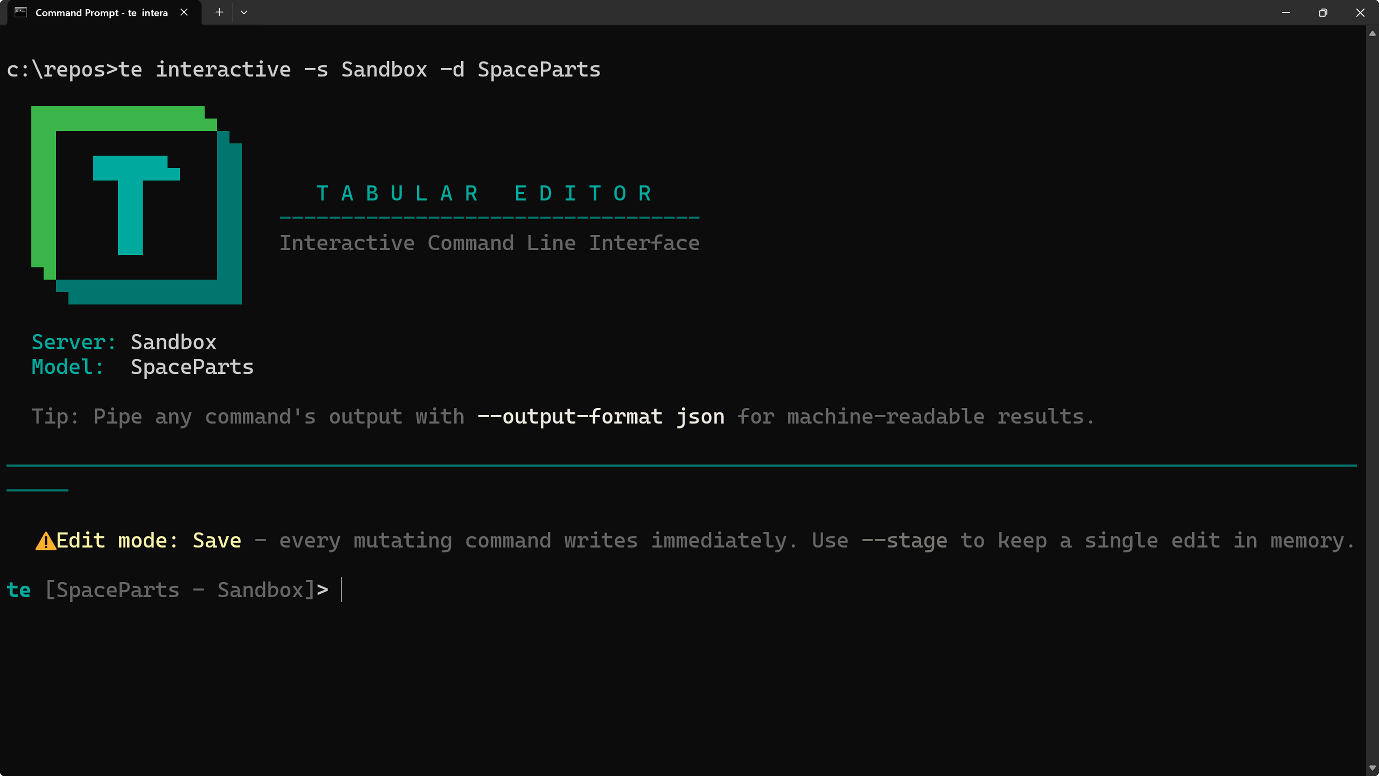
NOTE
In interactive mode, mutations are staged by default; they’re not written to the model until you save explicitly. This is configurable if you’d prefer changes saved as you make them.
Inside the session, you type ls, find "...", query -q "..." (the same commands as outside, minus the te prefix). Type exit to leave.
Interactive mode is a gentler on-ramp for CLI newcomers, and a convenient workspace for exploratory sessions against a single model. For automation, scripting, and CI pipelines, the non-interactive mode is what you’ll reach for.
Getting started
How to get the CLI today:
- Create a Tabular Editor account if you don't have one yet.
- Download the CLI for Windows, macOS, or Linux.
- Extract the download, make sure the
tebinary is on yourPATH, and runte --helpto verify. The install guide has per-platform specifics.
What’s next
This preview covers the core model lifecycle: inspect, edit, analyze, deploy, refresh, test. A few things aren’t in preview yet but are on the roadmap: integrations with DAXLib and DAX Optimizer, the DAX Debugger, and additional workflow commands. We’ll be transparent as the feature set evolves.
During preview, we’re iterating based on your feedback. Commands, flags, and outputs may be renamed or restructured as we refine the experience. The best way to help shape what ships at general availability (GA) is to try the CLI, tell us what works, and tell us what doesn’t.
At GA later this year, the TE CLI will require a license. Pricing is still being finalized; we’ll announce details well ahead of GA.
For further reading
- The XMLA endpoint for Power BI: how it works and how to use it (tabulareditor.com). Explains the underlying XMLA protocol that the CLI's deploy, query, and script commands use to communicate with Fabric and Power BI workspaces.
- How Tabular Editor supports agentic development for semantic models (tabulareditor.com). The product vision that shaped the CLI's design for both human developers and AI coding agents.
In conclusion
The Tabular Editor CLI brings everything you already know from Tabular Editor 3 (model editing, BPA, Vertipaq, query, deploy, refresh, test) to any terminal on Windows, macOS, or Linux, and any automation context. Humans scripting their workflows, agents working on models, pipelines deploying to production: all from the same executable.
The preview is available now, cross-platform, and open to all Tabular Editor users. Try it out, share your feedback, and help shape the 1.0 release.
Try the Tabular Editor CLI for scripted semantic model work.
Give Tabular Editor a spin