
Key takeaways
- Fabric natively supports visualization libraries: You can create and share visuals built with Vega, Vega-Lite, and D3.js using Fabric Apps.
- Fabric Apps are a new workspace item: Fabric Apps let you build web apps, programs that live in the browser, such as dashboards or apps to manage data and services.
- Data apps query Fabric data sources: A data app connects to and queries a semantic model with DAX, like a Power BI report, so you can build interactive visualizations from code.
- You build dashboards in code: Data apps have no UI, so you write HTML, TypeScript, and DAX, though the expected path is to use AI and coding agents to do most of the work.
- Agentic development makes them easy: Data apps give full flexibility over how data is presented and are quick to build with coding agents, but introduce new governance, consistency, and AI-dependence challenges.
- They raise questions for Power BI's future: Data apps don't replace the more mature, consistent Power BI reports, but they're more flexible and faster to build, so they'll play a growing role as AI advances.
This summary is produced by the author, and not by AI.
Build custom, interactive data experiences in Microsoft Fabric
For years, the Power BI community has been clamoring to have native support for visuals-as-code; the ability to create visuals, pages, or even entire dashboards with libraries like Vega, and D3.js. This is now possible in Microsoft Fabric with Fabric Apps, specifically, using a data app.
A Fabric App is a new item type that lets you create and distribute any interactive experiences in Fabric, rather than predefined reports, dashboards, and data agents. These are web applications (or web apps). A web app is any program that runs in a browser (like YouTube, Facebook, or Microsoft Word’s online editor) instead of one that you install on your computer (like Power BI Desktop or Microsoft Word).
One simple example of a Fabric App could be an interactive web dashboard that connects to and queries a semantic model. Because this dashboard is made entirely with code and not a self-service tool, this means you can create any design or functionality that you want. You can also drive the process entirely with a coding agent such as GitHub Copilot, Claude Code, or others.
A web dashboard can be highly bespoke, like the following example visualizing sleep data:
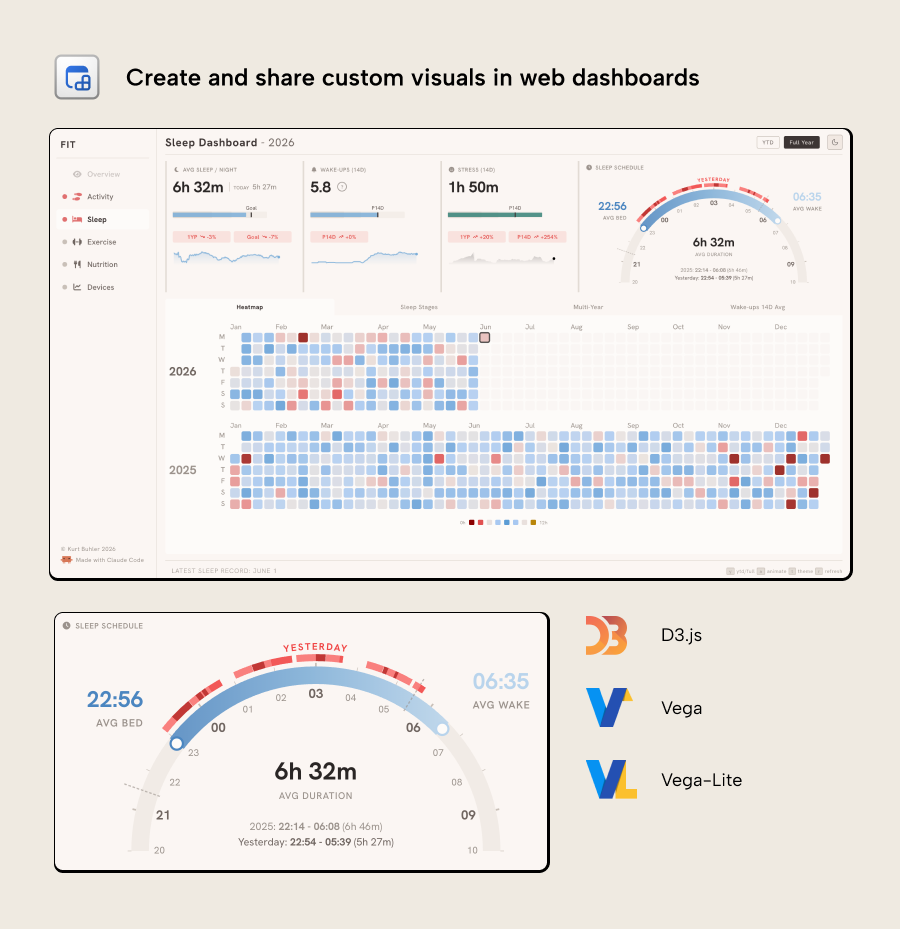
Since the dashboard is specified in code, you can (and must) control every pixel of how the data displays. This is true not only for the display, but also the interactivity:
The previous example shows the data updating in real time, querying a semantic model and having functionality one might expect in a Power BI report, like slicers, cross-filtering, and page navigation. All of this is built in a web app dashboard deployed to Fabric; a Fabric App.
This type of Fabric App is called a data app. Fabric Apps and data apps open the door to numerous exciting new possibilities in Microsoft Fabric for not just data visualization but creating novel and creative, interactive data experiences with your data. Most BI developers, analysts and business users don’t have experience with creating web apps, so the expectation is that if they create these items, they do so primarily using AI. However, it also means that Fabric opens up to new personas: web and frontend developers.
In this article, we’ll explain what a data app is, the basics of how it works, and what this might mean for data visualization in Power BI and Fabric.
WARNING
In this article, we try to give a “simple” summary of Fabric Apps and data apps. However, the truth is, Fabric Apps bring A LOT that’s new for Power BI and Fabric developers. We think it would be a disservice to gloss over this and say: “just ask AI to make you an app”.
We need to get into some details to explain this. Just know that this is new and complex topic, but we try to explain it simply. Understand, however: this is NOT “Vega Dashboards in Fabric”.
NOTE
Note that there are now four different things in Fabric called “apps” …
- Fabric Apps are an item type in Fabric for making web applications.
- Data apps are a template type of Fabric App that lets you easily connect to and query data.
- Org Apps are an item type in Fabric for distributing other items like Fabric Apps or Reports, among other things. Org Apps can work across workspaces.
- Workspace Apps are the precursor of Org Apps. They are a container linked to a single workspace for sharing Power BI content. They can only distribute Power BI item types like Reports or Dashboards.
Compare Fabric Apps and data apps
In a nutshell, a Fabric App lets you build and host applications in Fabric, with built-in authentication and as a managed service. At present, there’s two “types” of apps: operational (the default app) and analytical (a data app).
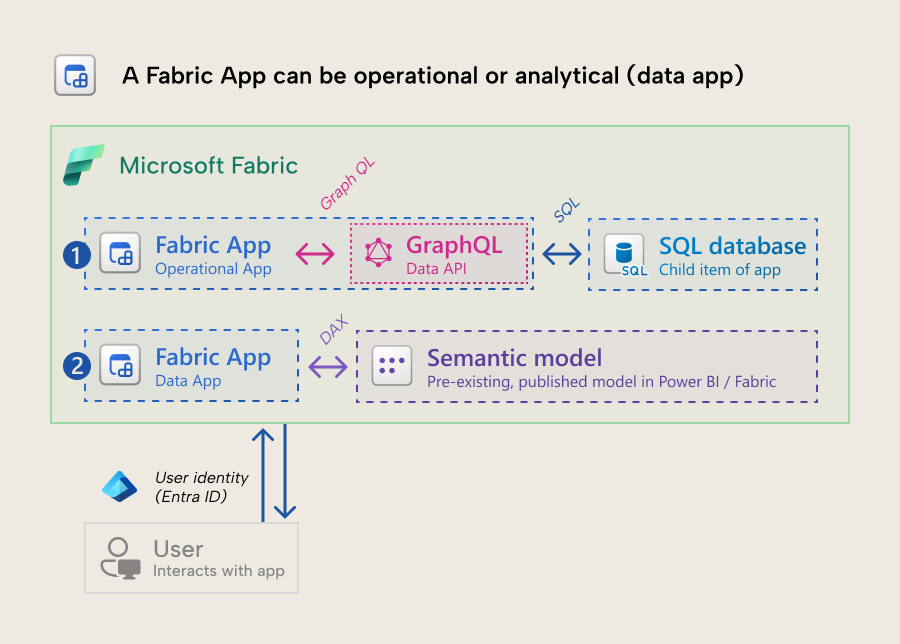
- An operational app is the default. When you create the app it provisions a managed SQL database as a child item that the app can read or write to via a GraphQL API.
- An analytical app (or data app) is a specific template where the app connects to a semantic model, and queries it via DAX. It doesn’t provision a SQL database.
This article focuses on explaining data apps.
What is a data app and how does it work in simple terms?
A data app is a webapp that you build and deploy in Fabric, which queries Fabric data sources. Currently, it only queries semantic models, but the SDK it uses also mentions lakehouses and warehouses, too. To be specific, you connect to a published semantic model and query it in DAX, just like you would from a Power BI report. These queries respect permissions and data security… presuming that you have set up the data app (and your semantic model) properly.
Here’s a simple overview of what it looks like when a user interacts with a data app:
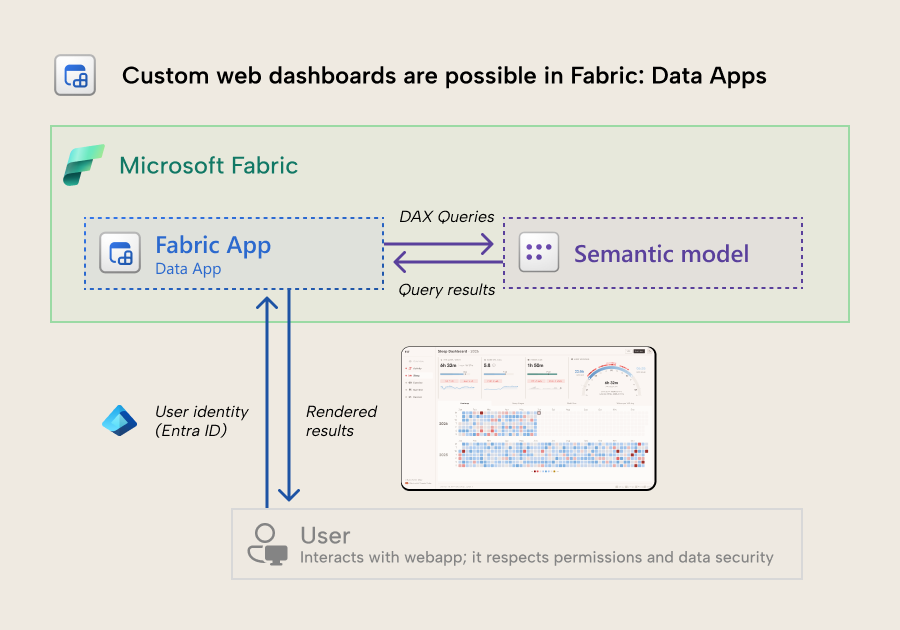
The query results can then be used to display tables, visuals, anything else, including custom functionality and integrations. Since this is a webapp and not just a self-service dashboard, you can build literally whatever you can specify in the code. This includes custom interactions or integrations, like getting the data to trigger or control other things. To emphasize… you must specify it in the code; there is no UI. All code must come from you (or your AI agent).
As you can see, it looks quite similar to Power BI reports. Both query the semantic model and render visuals for users. However, the similarities stop there.
For a frame-of-reference: comparing to Power BI reports
To help you understand what a data app is and how it works, it’s helpful to compare it to a Power BI report.
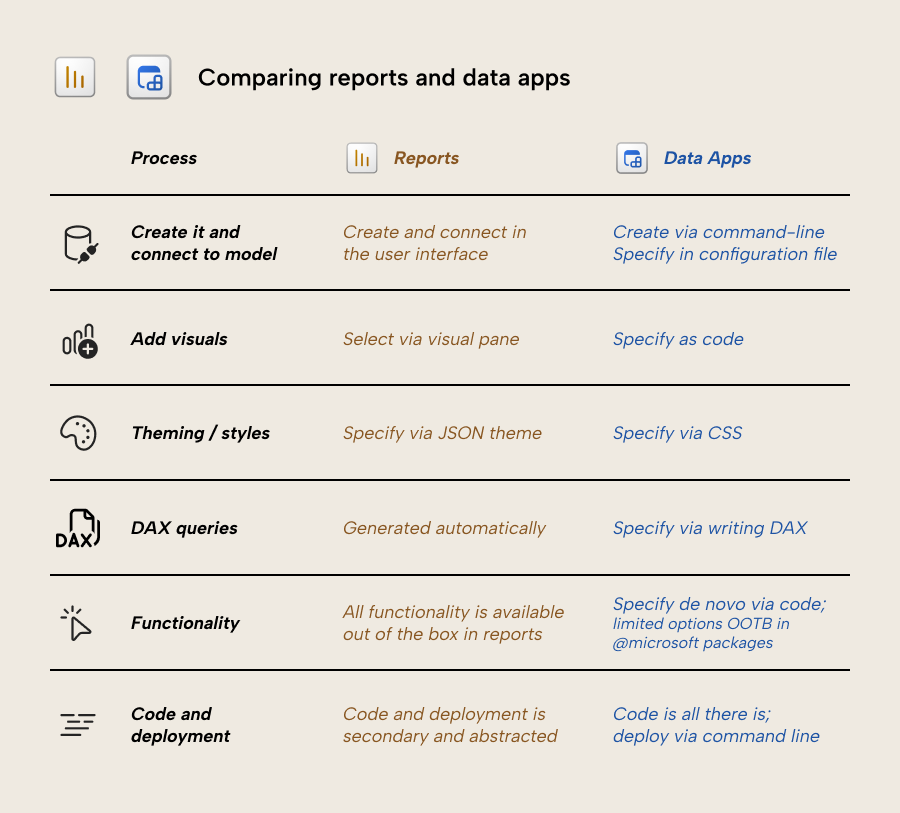
In Power BI, for most report authors, this goes as follows:
- You create a report and connect it to a semantic model.
- To add visuals, you use a user interface to select, position, and format them. They come with a preset “Power BI identity” in their configuration.
- A JSON theme file provides the general styles across the report, but you can override them with finite selections in a formatting pane.
- The visuals populate with data using DAX queries that are automatically generated. You can only view them with the Performance Analyzer.
- Visuals and reports come with a lot of functionality baked-in:
- Cross-filtering or highlighting between visuals with edit interactions.
- Drilldown or drillthrough.
- Filter pane and slicers, among many more.
- You can add, order, hide pages, all from the UI.
- When you save the report it saves it in a structured metadata JSON format (PBIR). You don’t need to use that format save for advanced scenarios; you can even deploy (publish) the report from the UI.
In contrast, in a data app you (with or without an AI agent) follow the below steps:
- You create a project of source files using a command-line tool in a terminal; there’s no user interface. The connection is specified in a configuration file.
- To add visuals, you must write their specification in code. You are unlimited in your flexibility, but it’s possible to write invalid, bad, or inconsistent specifications.
- A CSS file provides the general styles which can be overridden programmatically.
- DAX queries must be authored as .dax files. They must follow a special syntax to use string replacement to work with filtering and dynamic selections.
- Visuals have some functionality baked in with the Microsoft packages, like cross-highlighting. However, other functionality like drilldown, drillthrough, or even something like Export to Excel are not. Even separate pages must be coded yourself, from scratch.
- In a data app, you are working solely with the code. To view your app, you need to run a command to build it and run a local development server, then view it in your browser. To deploy it, you also need to run a command.
TIP
If it helps to use a metaphor: if a Power BI report is LEGO, then a data app is a 3D printer. That’s the caliber of difference in complexity, use-cases, and freedom that you need to keep in mind, here.
Unlike Power BI reports, all functionality comes from code, and not from clicking and dragging to a canvas or pane. In Power BI, code and technical complexity are hidden behind the low-code user interface. Even if you save your report using the PBIP format, you end up with JSON metadata with the PBIR files.
In contrast, a data app contains source code in multiple languages like HTML, CSS, TypeScript, JavaScript, and DAX, as well as various YAML configuration files. Obviously, it’s significantly more complicated than a Power BI report; it’s a project that you need to code, build, and deploy. Unless you’re a web developer, this means that you’ll likely use AI with coding agents like GitHub Copilot and Claude Code to author these files.
But that also means that it’s a lot more powerful, and you have a lot more freedom. If you want some sense of how the difficulty or complexity compares between Power BI reports and data apps with and without AI, see the below chart:
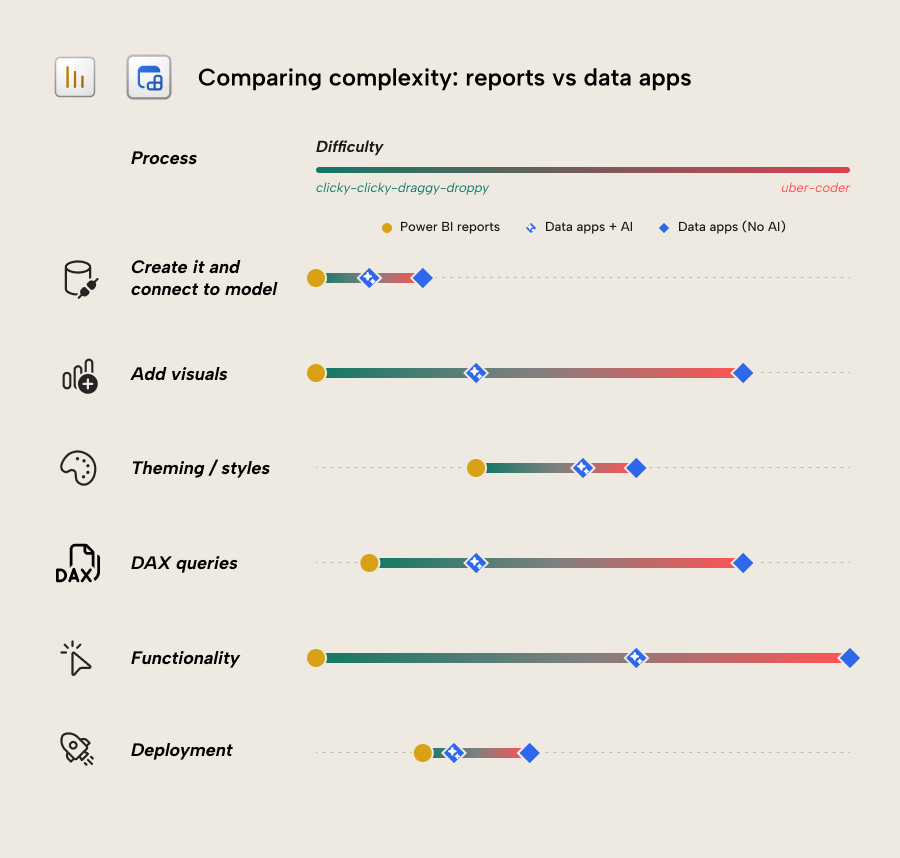
This is just a rough estimate but as you can see, data apps are more complex than Power BI reports in all scenarios, even with AI. Without AI, they are dramatically more complex, since you need to work with the code. In some cases, this difference is small (like creating and connecting it) and in some cases, it’s huge (like custom functionality). While this is subjective and will vary from person-to-person, the existence of this added complexity is important to understand.
TIP
It’s tempting to lean on AI and agents and neglect altogether the complexity of the file formats, languages, and frameworks in a Fabric app. Indeed, you can literally create and deploy an app end-to-end without seeing a single file or viewing a single line of code. However, this makes you fully dependent on the AI and agents to build, troubleshoot, and optimize the app. If something goes wrong or you need to make changes, you’ll be unable to do it without AI.
It’s therefore a good idea to at least familiarize yourself with at least the basics so that you understand where to look and what to prompt when something goes awry. You don’t need to become an expert in web development to use and get value from a data app (just like Power BI).
The more you know, the better results you’ll get… with or without AI assistance (true with anything).
So, what’s actually inside of a Data App?
In a data app are various files, written in several different languages. These files specify everything: your DAX queries, visuals, formatting/styles, configuration, and functionality. As a BI developer, most of these files (except for the .dax queries and .json specifications) are probably unfamiliar, so it’s good to get a high-level understanding of what’s there.
First, there’s the boilerplate and config files, which are relevant for your entire app:
- Webapp scaffolding files that contain the various ingredients you need in a webapp. There are other technical and helper files, as well as build artifacts, which go beyond the scope of this article. It’s a good idea to reference documentation about these (from Microsoft, React, or Tailwind) or even just ask your AI agent to explain it to you in layman terms.
- A
fabric.yamlfile describes which workspace and semantic model you connect to, whilerayfin.ymlcontains the configuration for the backend. We’re not going into details about Rayfin and the backend of Fabric Apps, here; you can find more about that on Microsoft Docs. - A
global.cssfile provides the centralized styles and formatting for the app. You can think of it like a Power BI theme file in a report, but it’s CSS and not JSON.
Then, there are the actual source files that make up your data app. Consider a single visual that renders data from a DAX query:
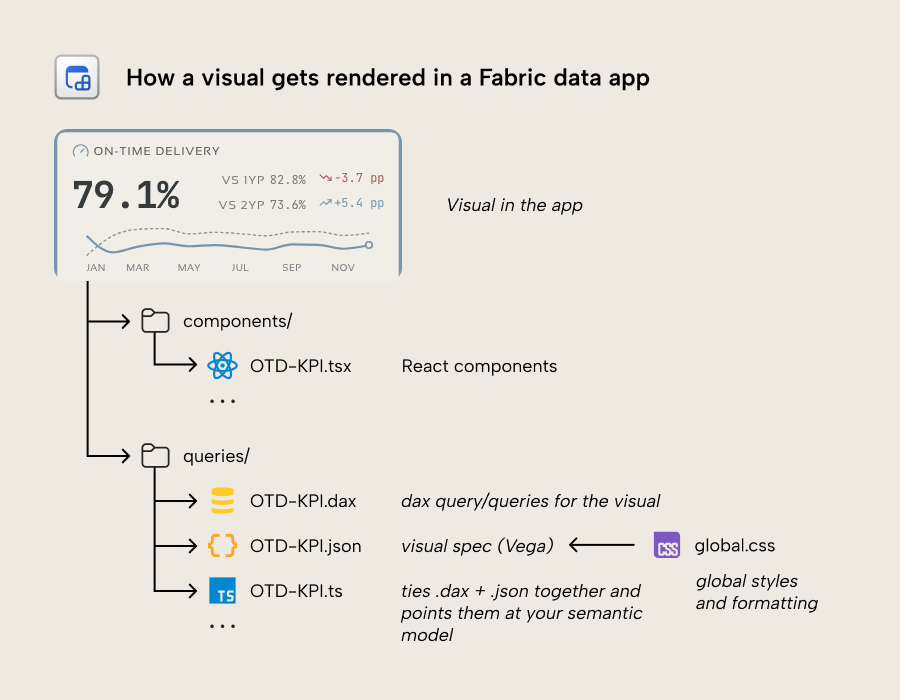
Each chart in a data app dashboard is typically made of a React component (the .tsx file; .ts and .tsx are TypeScript source files) that uses standard ingredients from Microsoft to make charts and tables. This file is built from three small files in your project that share a name:
- A
.daxfile with the DAX query for the chart. This DAX file contains placeholders for elements like filter values which are swapped out using string replacement to get the right value depending on a filter or interaction. The key difference with a Power BI report is that in Power BI you don’t write the DAX for your visual and it’s not visible in a file; it’s generated. Having the DAX in a file means more work, but also more control and more visibility for debugging and troubleshooting, if necessary, because you can open this DAX file in Tabular Editor and DAX Studio and run queries interactively. There’s a lot of interesting and valuable aspects to having the query available as a file like this; we’ll get into that in a separate, follow-up article. - A
.jsonfile with the visual specification. This is only if you are using Vega-Lite with the components provided by Microsoft; with other libraries, this works differently. The formatting of your visual is provided by theglobal.cssfile, but can also be overwritten, here. - A
.tsfile that ties the.daxand the.jsontogether and points them at your semantic model. This file is like a “factory” that takes the DAX to query your model, using various configuration files and helper packages.
Here’s an example of a .dax file that the data app expects, authored by an AI agent using the skills that come with the @microsoft packages:
// by-region.dax
EVALUATE
CALCULATETABLE(
    FILTER(
        SUMMARIZECOLUMNS(
            'Regions'[{{LEVEL}}],
            "OTD %",     [OTD % (Lines)],
            "OTD % 1YP", [OTD % (Lines) 1YP],
            "vs 1YP",    [OTD % (Lines) vs 1YP (Δ)]
        ),
        NOT ISBLANK([OTD %])
    ),
    'Date'[Calendar Year Number (ie 2021)] = {{YEAR}},
    'Exchange Rate'[From Currency] = "EUR"{{FILTERS}}
)
ORDER BY [OTD %]
Note that the filters in CALCULATETABLE have a peculiar syntax; there are placeholders {{LEVEL}}, {{YEAR}} and {{FILTERS}}. That’s because the data app uses string replacement to construct the final query when the app is running; it does a find and replace. That’s what the TypeScript (.ts) file does. The corresponding by-region.ts file is as follows (you don’t need to know TypeScript to understand what it’s doing, here):
// by-region.ts
import type { ColumnMetadataMap } from "@/lib/to-data-table";
import type { CrossFilter, RegionLevel } from "@/lib/cross-filter";
import { buildFilterDax } from "@/lib/cross-filter";
import baseQuery from "./by-region.dax?raw";
import vegaLiteSpec from "./by-region.json";
const connection = "spaceparts";
export function byRegion(filter: CrossFilter) {
  const level: RegionLevel = filter.regionLevel ?? "System";
  const columnMetadata: ColumnMetadataMap = {
    [`Regions[${level}]`]: { name: "Region", displayName: level },
    "[OTD %]":     { name: "OTD",    displayName: "OTD %",     format: ".1%" },
    "[OTD % 1YP]": { name: "OTD1YP", displayName: "OTD % 1YP", format: ".1%" },
    "[vs 1YP]":    { name: "vs1YP",  displayName: "vs 1YP",    format: "+.1%" },
  };
  const query = baseQuery
    .replace(/{{LEVEL}}/g,   level)
    .replace(/{{YEAR}}/g,    String(filter.year))
    .replace(/{{FILTERS}}/g, buildFilterDax(filter, "region"));
  return { connection, query, columnMetadata, vegaLiteSpec };
}
As you can see, it’s providing things like the connection, filter config (CrossFilter) and even mapping the column metadata for the Vega visual (which would be by-region.json). Then, with query at the bottom, you see the string replacement that builds the DAX query.
This is used in the visual specification:
// by-region.json:
{
  "$schema": "https://vega.github.io/schema/vega-lite/v6.json",
  "title": "On-time delivery by region",
  "mark": { "type": "bar", "cornerRadiusEnd": 3, "tooltip": true },
  "encoding": {
    "y": {
      "field": "Region",
      "type": "nominal",
      "sort": "-x",
      "axis": { "title": null }
    },
    "x": {
      "field": "OTD",
      "type": "quantitative",
      "axis": { "format": ".0%", "title": "OTD %" }
    }
  }
}
These three files together provide the working visual. Unlike Power BI reports, where you just have the one PBIR JSON (which you don’t even need to see or know about) per visual, you must write multiple files like this to create the data app.
Then, when somebody opens the deployed app, they sign in with their Entra account (Fabric SSO is required) - the same one they already use for Power BI. Then, any row-level security in the semantic model applies the query the same way it would for a Power BI report. The query returns the data, and the user sees a result in the rendered visual.
NOTE
Microsoft provides various helper packages and objects for you to use Vega-Lite; that’s the recommended path for visualizing data in data apps.
However, you aren’t limited to Vega-Lite or these components; you can also use your own. For instance, you can also use other visualization libraries such as D3.js instead. This gives you much more flexibility, but then you do need to wire up some of the things Microsoft’s library gives you out of the box (theming, format strings, cross-filtering).
We’ll provide more details and guidance about what to use when and why in future articles and videos.
A Data App isn't (just) a dashboard
We’ve focused so far on the data visualization and dashboarding capabilities of a data app. However, it’s important to clarify that this is only a small fraction of what a data app can do. It can also:
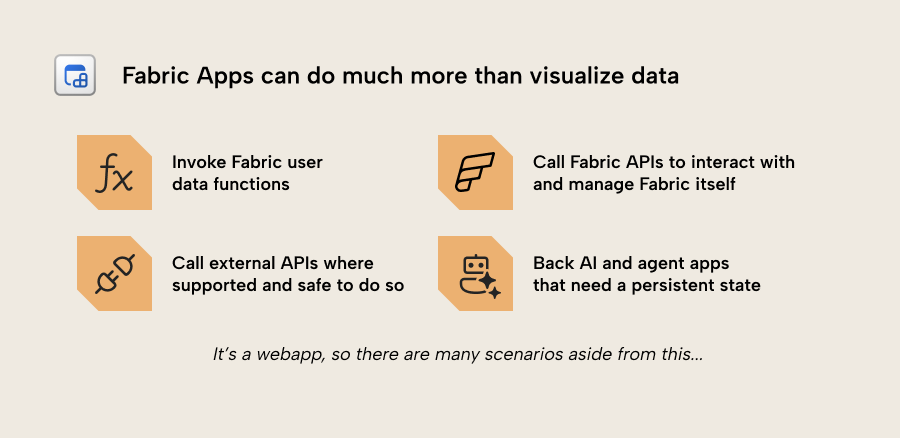
- Invoke Fabric User Data Functions which can read and write data from Fabric for cases like writeback and more.
- Interactions with the Fabric APIs to manage Fabric itself.
- Call external APIs in limited scenarios. Basically, you can’t use custom authentication or Azure Key Vault or similar, yet.
- Back AI applications that require a persistent state.
These are just a few high-level examples. We’ll continue to focus on dashboarding, but it’s important to emphasize that a data app isn't just a dashboard… it’s a webapp.
Create a custom interactive dashboard in a data app
You can create much more than a dashboard with data apps, but it’s a good first step to start experimenting with this new tool. How to create a data app is described in detail in the Microsoft documentation, so we won’t repeat this verbatim. Here’s a quick step-by-step summary
WARNING
The commands in this section use bun and bunx instead of the more common npm and npx which are suggested by Microsoft. We prefer bun for performance and security reasons that are beyond the scope of this article. To install bun, see their docs.
- Check the prerequisites. You need:
- A published Power BI semantic model on a Fabric or Power BI capacity
- Build and Read permission on that model
- Contributor or higher on the target Fabric workspace; where you put the app.
- A Fabric admin who has enabled:
- “Fabric Apps” tenant setting
- “Dataset Execute Queries REST API” tenant setting
- Scaffold the project locally. You use the Rayfin CLI to build the app. In a terminal, run one command to create a new data app project on your laptop:
bun create @microsoft/rayfin@latest -- "MyApp" --template dataapp --workspace "WorkspaceName"
NOTE
Creating a data app locally is the same as creating one in Fabric. When you create the item, you get the same instructions to work locally in the terminal.
This is what you see when you go to create a data app in Fabric; instructions for local development:
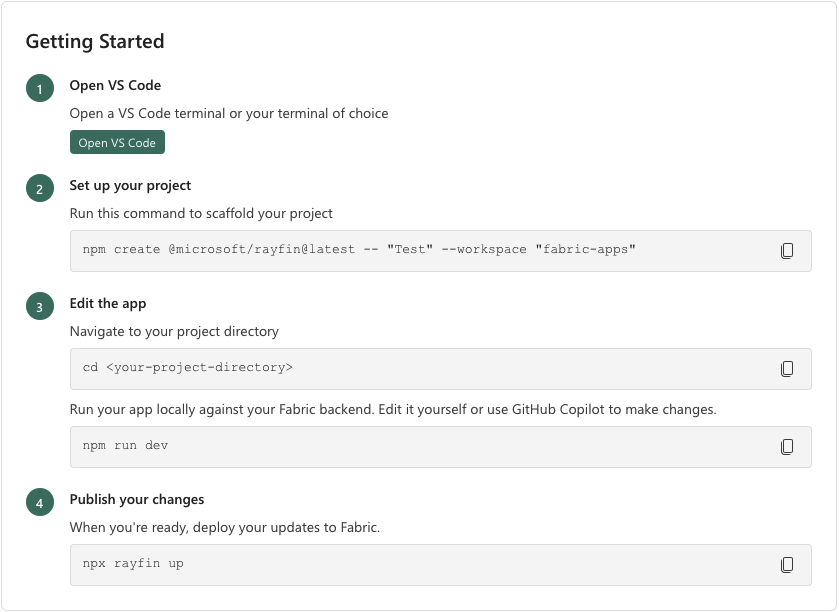
NOTE
This further emphasizes the code-first workflow, here.
This creates a folder with the data app template inside it, plus a set of agent skills that teach your coding agent how the project is organized (an AGENTS.md file, an .mcp.json file, and a set of skill files under .agents/skills/). These skills are focused mainly on DAX, semantic model references, and chart styling. You can also install or refresh these later with bunx rayfin ai-files install.
- Open the folder and start working with the code or with a coding agent. Fabric Apps presume that you are using agentic development to create your app. With the agent, you need to describe the dashboard you want and share a link to your semantic model. The link contains the workspace and model IDs.
For your prompt, you may want to create a markdown file that documents the requirements for whatever you want to make. However, it also works fine to iterate and work incrementally after providing a short, high-level overview in your prompt.
After submitting the prompt, the agent will start creating the files that we mention above, like the visual specifications, the DAX queries, and the TypeScript code that glues it all together. These DAX queries are what will be sent to your model via the executeQueries API once you run and open the dashboard, either locally or after deploying it to Fabric.
TIP
You can also use other tools like the Fabric CLI and the Tabular Editor CLI to make this easier. That way, the agent can do everything without you manually copying and pasting, and it has more effective tools to work with Fabric and your semantic model. For instance:
The agent can use the Fabric CLI to get the workspace and model IDs, or discover similar items to get context for your app.
The agent can use the Tabular Editor CLI to more efficiently browse your model (and using fewer tokens) than other approaches. It can also make changes to your model at the same time as you work on the app.
- Iterate locally. Each round, the agent discovers the model’s schema, authors and tests the DAX from a terminal, writes the chart specs and the layout, and applies the styles. To view what you’ve made in the browser (at localhost:5173), you have to run the following in a terminal (more likely your agent will do it for you):
bun run dev
When you open the web app, it should query the semantic model via the executeQueries API, and data will display in the visuals.
TIP
We recommend that you do not validate your app with AI and agents by using Playwright. This is expensive, slow, and inefficient. It’s far better and faster to just visually inspect the app yourself and provide direct feedback to your agent.
Additionally, you should ensure that you ask the agent to validate the DAX before you start looking at the visuals. Remember that you can always get the DAX queries into Tabular Editor (or tell the agent to use the Tabular Editor CLI) to validate them, visually.
- Deploy to Fabric. To deploy to Fabric, use the following command:
bunx rayfin up
The app builds, static files are uploaded to OneLake, and a Fabric App item is created or updated in your workspace. End users open it inside the Fabric Portal with their own Entra identity.
- Validate the app. Open the app in Fabric and check that the data still displays. Share with one or more users to verify with them.
The whole process is straightforward if you are using AI to help you. In our experience, you can make a professional-looking dashboard using data apps in 10-30 minutes. That’s not to say it’s validated, tested, and ready for users, obviously. But still… it’s very impressive… it opens a Pandora’s box of possibilities, considerations, and – if we’re honest – some rather uncomfortable questions.
What this means for Power BI reports
To summarize, Fabric now supports data visualization using established dataviz libraries like Vega or d3.js that have a grammar of graphics. You can create and deploy a dashboard entirely in code with a workflow that suits both humans and agents. You can leverage the distribution maturity and security in your Fabric data platform, and there is no cost to host it; the cost for your Fabric Capacity is only that of your DAX queries, just like a normal Power BI report.
This means in effect that you have another, new option to visualize data for business users that is flexible, fast, and scalable with agentic workflows. It is entirely possible to have your dashboards and reports made entirely in data apps. So… where does this leave Power BI reports? Well as always this is a nuanced and grey area, but it touches on some uncomfortable truths.
We’ll wade into this in more detail in a separate, follow-up article and video. However, this is going to be a controversial topic, so we’ll already touch on some of our key impressions, up-front, based on testing we’ve done so far. Note that these aren’t exhaustive lists, just the most important things that we want to highlight, today.
Key benefits of Data Apps for data visualization
If you use a data app to visualize your data, you get benefits like the following:
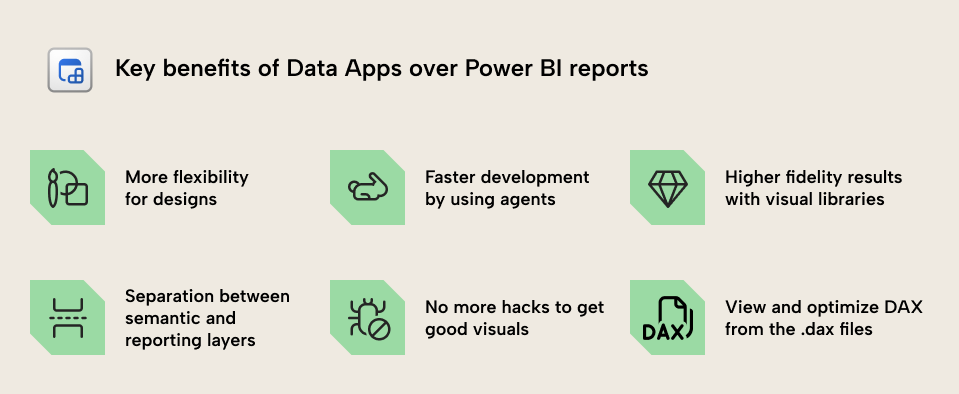
- Unlimited flexibility. In Power BI reports, you’re restricted to the capabilities of the tool and its rendering engine. With a data app, you can manifest anything that can be specified by the code, including both the visual appearance and functionality.
- Faster development. With data apps, you have a framework that works better with coding agents and AI out-of-the-box. In my testing, a dashboard made in a data app takes me ±80% less time than it does to make the same bespoke design in a Power BI report. It’s also easier to make changes, since you can just specify the change in natural language and visually verify the result. This means that the total cost of ownership for a data app may also be much lower than a Power BI report. However, it remains to be seen if this will remain true given the added cost of tokens and AI usage (which also now exists with Power BI development, but is less common or necessary).
- Higher fidelity results. Using data apps, you can make more impressive and high-fidelity dashboards. This is in part due to the flexibility, but also the maturity of the visualization libraries that you use.
- Separation between semantic model and reporting layer. In Power BI, the moment you need more flexibility and customization, you’re forced to bend the visuals with odd configuration, but worse, atypical DAX and semantic model patterns. Power BI semantic models have an expensive and complex coupling with reports. If you use data apps, then this report-specific logic can live in the reporting layer.
- No more hacks to get good visuals. In recent years there’s been an evolving trend in reports with visuals that use HTML, SVG, and convoluted configurations to achieve reporting requirements. Now, all of this can be built and templated into the code.
- You can optimize the DAX. Since the DAX code for each visual is explicitly available, you can tailor and optimize it, yourself. This isn’t possible in Power BI, where queries are generated.
So, clearly, there’s some pretty strong positives and compelling arguments to lean into data apps for data visualization and analysis. What about the negatives?
Key considerations and caveats of data apps for data visualization
Data apps are not all sunshine and rainbows. They definitely aren’t for every scenario or team to use. There are some key caveats to keep in mind:
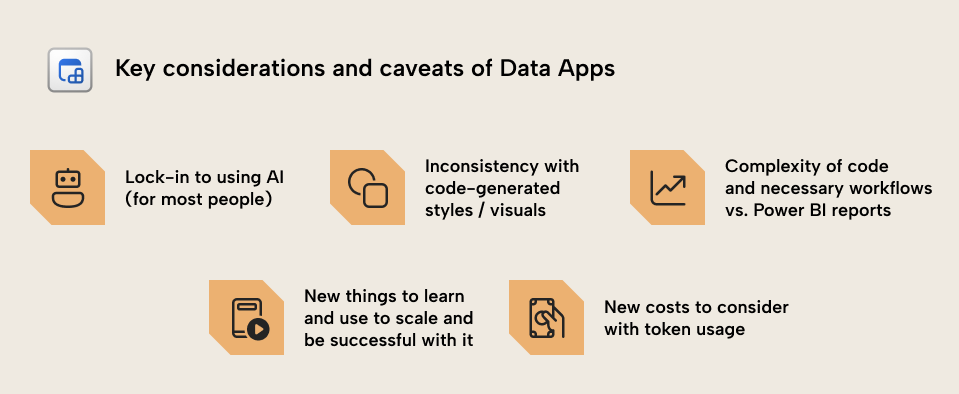
- Dependency on using AI. Most Power BI and Fabric developers do not have experience building and maintaining web apps. They don’t know JavaScript and React and will therefore be entirely dependent on AI to generate the code. Honestly, it’s likely that most people who build a data app won’t even read the code. This is problematic for obvious reasons, as it could risk quality, maintainability, and even security. If you suddenly can’t use a coding agent, or if your AI spend gets too high… how will you maintain your data apps, especially if you don’t understand even the basics of what you’ve built?
- Inconsistency. Because a data app is more flexible, and because you’re likely going to make it by using AI, you’ll likely have difficulties ensuring consistency between different visuals, pages, and apps. This is a well-known challenge with using AI to generate code, and it requires adopting more mature design workflows and tools that will be new (but arguably rewarding to learn) for report developers and analysts. This skill set and maturity will become essential for teams to use and scale with data apps effectively.
- Complexity. A data app produces files with HTML, CSS, and JavaScript, and it also requires a build step; it’s literally web development. For business reporting scenarios, a web app is probably overkill. However, it remains to be seen whether this still applies once teams have adopted agentic workflows with AI. If you can get a better result in less time and resources, is it really something you should reject outright? Regardless, for simple scenarios where you just need a basic report, Power BI will remain simpler, more mature, and more robust.
- New things to learn and use. For many organizations, users have only just now started getting familiar with using Power BI reports. Putting a new type of dashboard in front of them – especially one with a bespoke and inconsistent user experience – is going to create problems. Problems with adoption and trust, foremost. Furthermore, with regards to development most users are still learning about agents and AI; these workflows are still evolving, and require a significant mindset shift, and to reiterate, they’re also partly dependent on adopting mindsets, skills, and tools found in software development.
- New costs. Most people will use AI and agents to build data apps. That means that there are new costs to consider in terms of token spend, or investments in local LLM infrastructure. This will vary greatly between projects, individuals and teams… for some it is possible that the time and cost savings may outweigh any new costs from tokens. For others with less disciplined oversight and maturity this could balloon into a surprise AI bill and a messy result.
WARNING
It’s important to emphasize that the skills required to create and support a web app are different from the skills you use to create and support a Power BI report. There are many areas where there’s minor overlap. But by-and-large, if you plan to use data apps instead of reports, you can expect that you’ll need to invest significantly in upskilling and reskilling yourself… even with AI. This is true not only for obvious things like frameworks or code, but even design, since there are more possibilities and web apps require more structured and mature frontend design practices.
So, in summary, Fabric Apps – and data apps in particular – are very exciting. You can now create, deploy, and share custom web dashboards in Fabric, and this alone will undoubtedly generate a lot of excitement among the Power BI and Fabric community. However, it opens the gates to entire new ways of using and interacting with data. It also remains to be seen if the new considerations they bring will offset their potential benefits. What’s clear, though, is that Power BI reports aren’t going anywhere, and as of today they do remain the best approach for simple and self-service scenarios.
As always, it depends; be careful to not let yourself be baited into excitement by an impressive demo, screenshot, or AI-generated result, and be mindful that this is very new.
A last point… it’s not really that new, actually…
While data apps are new in Fabric, custom web and embedded dashboards are themselves certainly not a new concept. Before Power BI (and even still today), it was common to see organizations with custom web dashboards and reporting built using approaches like this. It’s a valid, mature approach with time-tested workflows and expertise that’s been around for a long time.
However, it was complex and expensive to set up, that expertise was rare, and it didn’t enable self-service analytics for business. Agents and AI change the equation, though, making it suddenly possible for any team to consider this avenue if they so choose.
For enterprise and centralized BI scenarios, this may be an interesting scenario to explore alongside Power BI reports. You get more flexibility, better integration with AI, and code-first artifacts that you can better tailor to your development and CI/CD. Data apps might be interesting if your team has a high maturity, developed consistent agentic workflows, or is struggling with the fidelity and visualization capabilities of Power BI reports. If data apps are something you’re thinking of exploring, then it’s likely worthwhile to consider the existing approaches and lessons from the past, rather than trying to tread it anew.
For further reading
- Fabric Apps overview (Microsoft Learn). The official starting point lists the current templates, tenant settings, and supported regions.
- Execute Queries REST API for semantic models (Microsoft Learn). This is the DAX-over-HTTPS API that a data app calls under the hood for every query.
- Vega-Lite documentation (Vega). The chart grammar documentation explains the visual specification format used by the data app template.
- D3 documentation (D3). D3 is the alternative when you need a chart shape Vega-Lite can’t express, or pixel-precise control over a bespoke visual.
In conclusion
Fabric Apps let you create and distribute web applications in Fabric. A data app is a template of a Fabric app, where you query a semantic model in DAX and visualize or use the data in an interactive experience. You can create and distribute dashboards in data apps, which can be made faster and produce higher-fidelity, more flexible outputs. However, they bring new caveats and considerations that most organizations will need to keep in mind before using these in addition to or instead of Power BI reports.
In future articles, we’ll discuss further topics like how to choose between Power BI reports and a data app, how you can use Tabular Editor to help you test and debug your data app DAX queries, and why we think data apps are an amazing thing for semantic models, especially for enterprise scenarios.
Get the most of Data Apps by using Tabular Editor 3 with your semantic models
Give Tabular Editor a spin