
Key Takeaways
- Claude Data expands Claude Dashboards: Among other things, it adds certified queries, live sharing, version history with rollback, and design system support.
- The semantic model is still the brain: Certified queries, live sharing and the new queries Claude writes all run on your semantic model and its measures. Better models leave less room for Claude to invent alternate KPI definitions when a certified query doesn’t cover the question yet.
- A certified query is a query that an editor has approved: Certification means that Claude will prioritize it for re-use, and that dashboards using it show a Certified badge. Certification applies to the query, not to every number calculated from its result. A certified query doesn't replace your semantic model; it runs on the model and uses its measures.
- A design system could be a bigger deal than it sounds, but in its current form it's mostly a theme: Color, fonts, and how elements look. UX is missing, and Claude can invent subtly different UX patterns that erode users' intuition across dashboards. We elaborate on this problem in next week's blog.
- Claude Data is a new player in self-service, low-code BI: Building is easy for non-developers, and governance capabilities are just enough to make it palatable to a business. This fits what Anthropic says it wants: for Claude to be part of your business stack. It does not mean that Claude Data passes the bar for critical assets with a longer lifespan: there is no source control for dashboards, and we found no way for a pipeline to deploy a dashboard, so promote important dashboards to Power BI reports or Fabric Apps, built on the same semantic model.
This summary is produced by the author, and not by AI.
NOTE
Claude Data is now generally available on Pro, Max, Ultra, Team and Enterprise plans. Certified queries and live sharing are in beta and only available in Team and Enterprise organizations, on by default on Team and off by default on Enterprise. We tested them in a Team organization in November 2026.
Claude Dashboards is now Claude Data
In October 2026 we looked at the latest new thing in front-end land: Claude Dashboards (beta). Our general feeling then was that they are useful for fast prototyping and personal BI scenarios, but lacked essential components for scaling them to broad audiences. One month later, Anthropic rebrands Claude Dashboards and makes them generally available as Claude Data, along with two other beta artifact types (Whiteboards and Sheets). It's not just a rebranding, though; there are new features that close some of the gaps, and align with Anthropic's ambition to become part of your business stack. If you build semantic models in Power BI or Fabric, people in your organization will build Claude dashboards on them. With this blog, we want to look at where each new feature fits next to the models and reports you're already governing.
What does Claude Data add to Claude Dashboards?
What's new? Quite a few things: certified queries, live sharing, version history with rollback, and design systems. Other additions like scroll-driven pages (Scrollyteller), written analyses (Visual analysis) and short videos (Visual short) extend the digital richness of analytics, but we want to focus on the features that change those gaps we highlighted. Of the gaps we named in October, these features partly close three of them: certified queries nudge Claude to re-use approved queries instead of writing new ones, version history keeps earlier versions (though there is still no source control for dashboards), and design systems give dashboards a shared look (though not shared components).
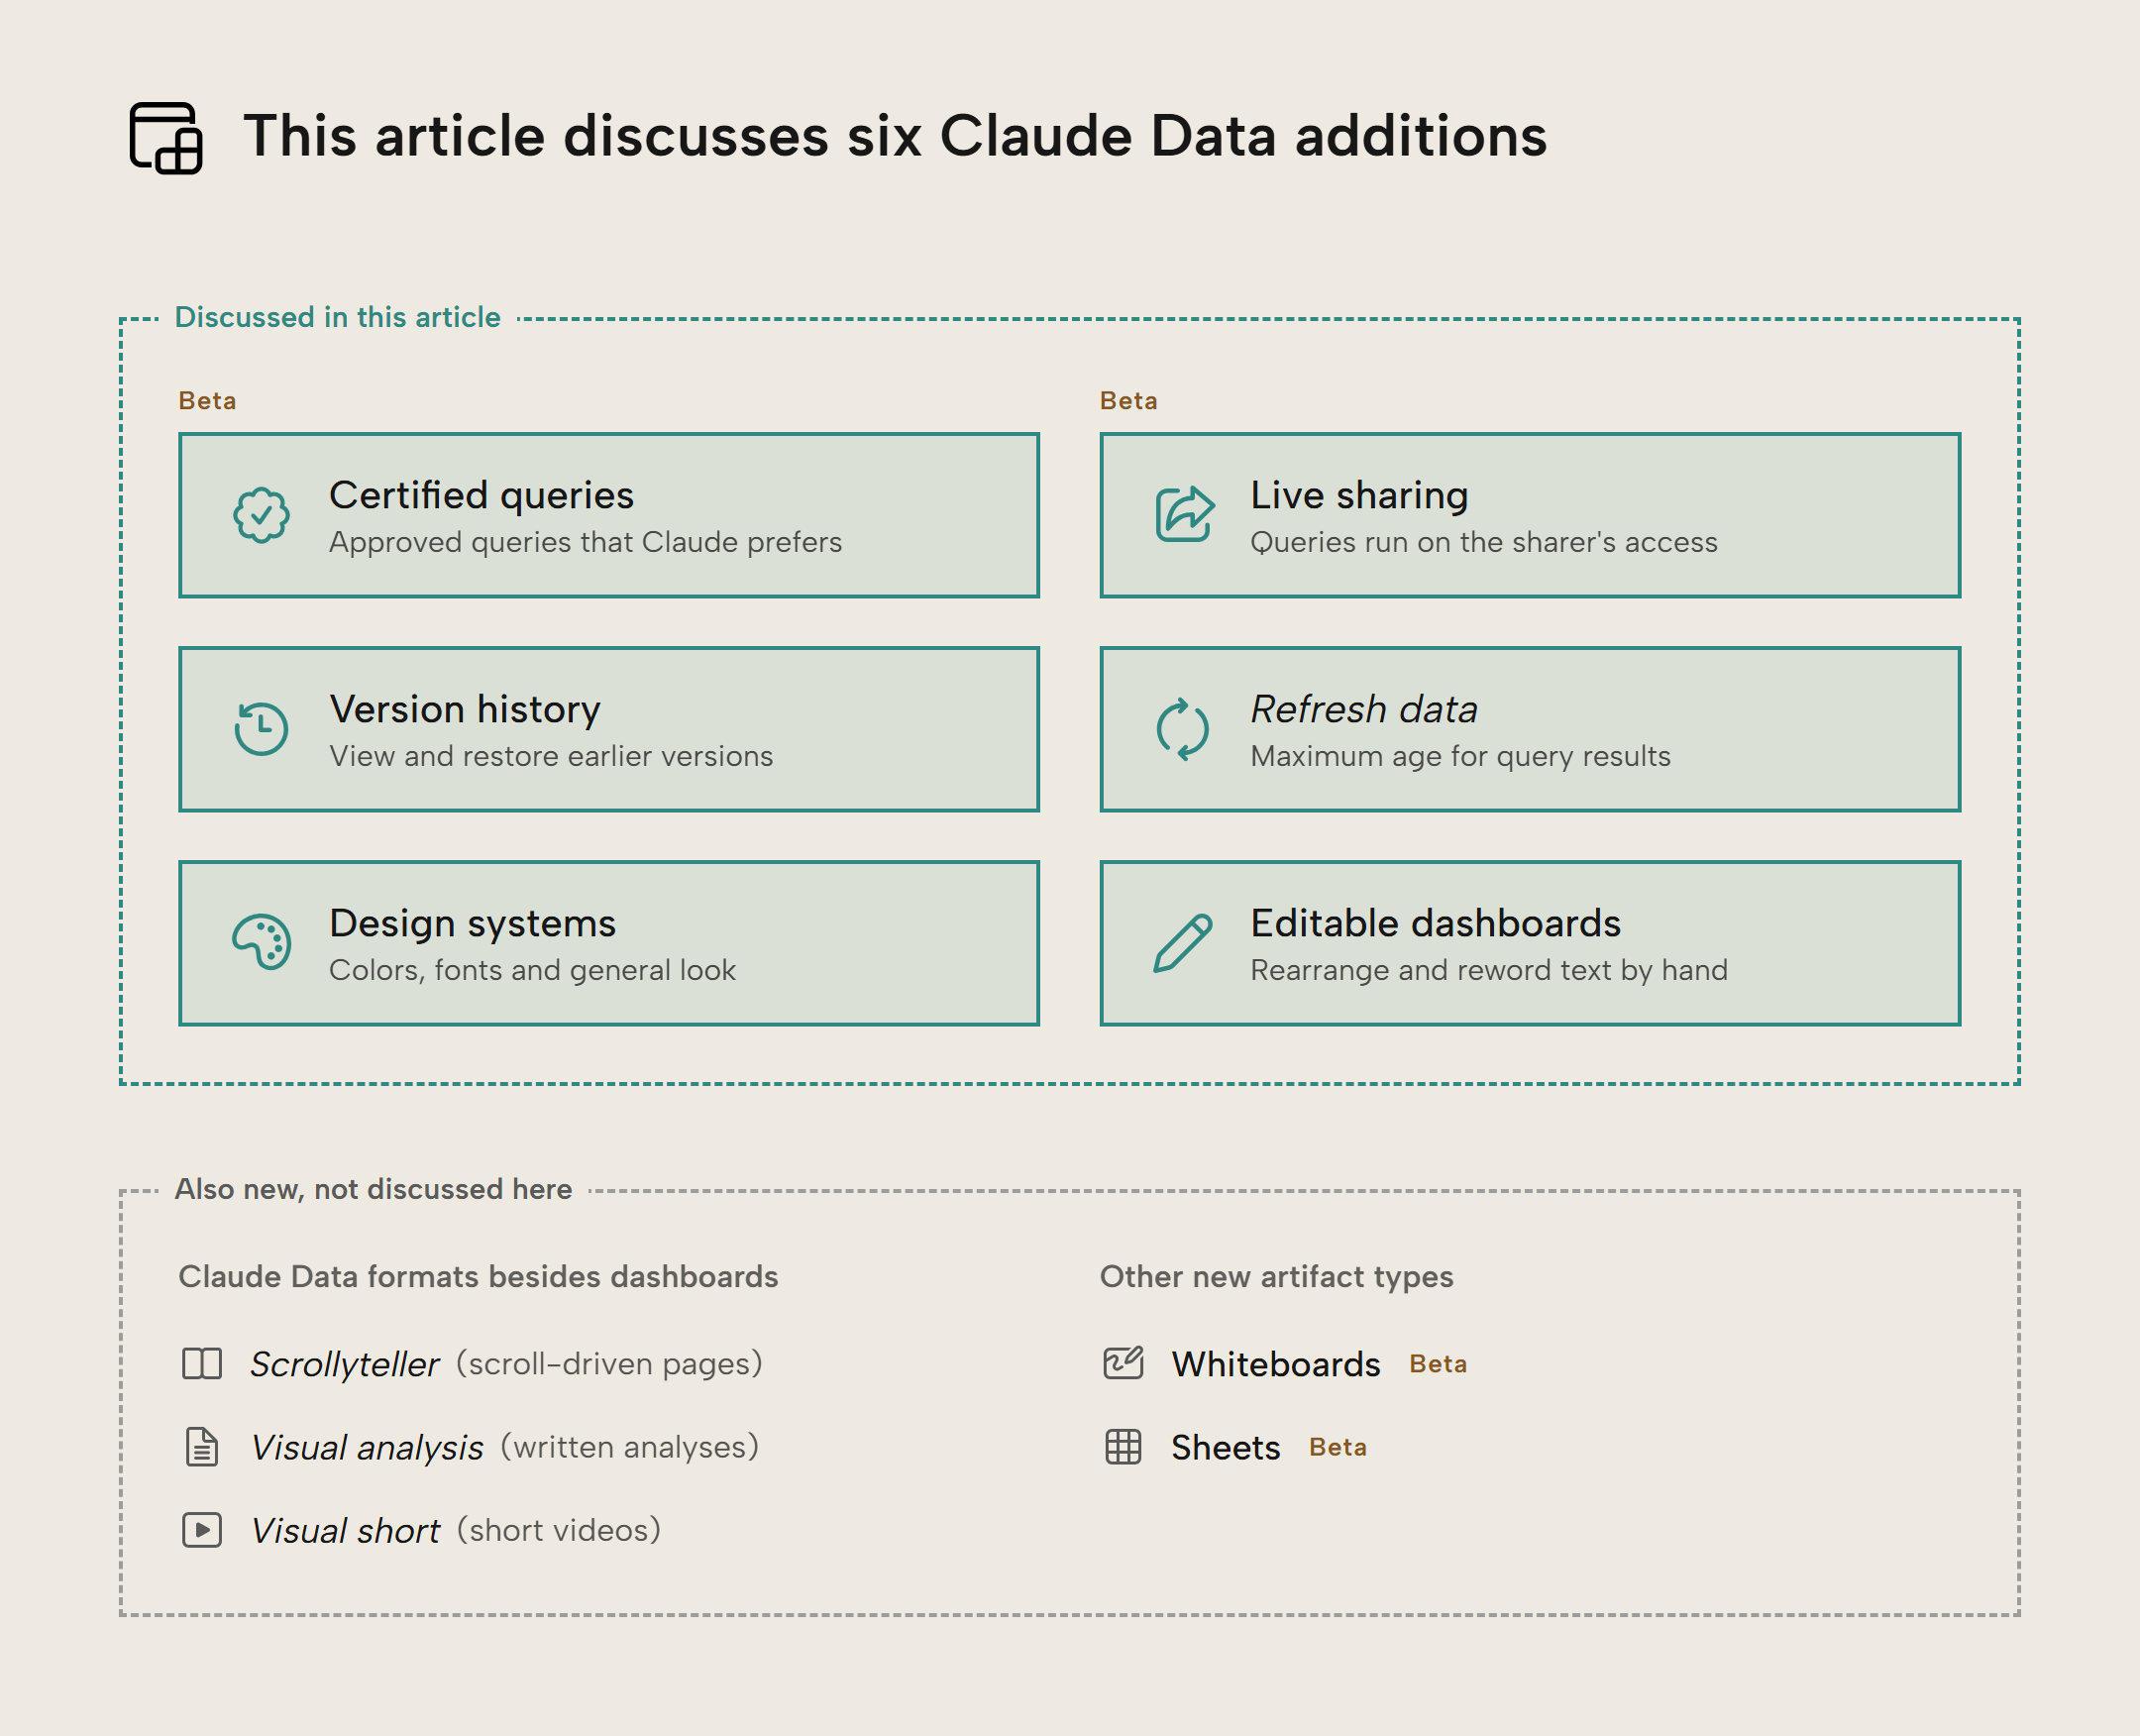
In short, the new features are:
- Certified queries: a query an editor has approved and Claude will prefer when it fits, and dashboards that use it carry a badge. This is different from Fabric's certification, where the label applies to the entire item (a semantic model, a report, etc.).
- Live sharing: being able to share a number or visual you think someone else should see, regardless of whether they have existing permission to see it.
- Version history: the option to view past versions and who made them, and restore to earlier versions. If you've used OneDrive's version history, this will be familiar.
- Refresh data: set a maximum age for the dashboard's query results, i.e. each visit, 5 minutes, an hour, a day or a week. Anthropic calls this caching: the dashboard keeps its query results in cache, and Claude runs the dashboard's queries again when someone opens it and the results in the cache are older than that age. This does not refresh the semantic model, so a dashboard on an import model is never more current than the model's last refresh.
- Support for design systems: set which colors, fonts, and general look your dashboard should have.
- You can also make dashboards "editable", which -- in our tests -- meant you can rearrange elements and reword text by hand.
NOTE
The Help Center says that edits you make directly appear in version history. In our tests, text edits by hand did, as one version per save, but style edits in the Design pane (colors, corners) made no version.
What does Claude Data mean for your semantic model?
- Certified queries are saved DAX queries on your model's measures, and the new queries Claude writes can use the same measures.
- Refresh data runs the dashboard's queries again, but it doesn't refresh the semantic model.
- Live sharing runs the queries with the sharer's access to the semantic model instead of the viewer's. Through the Fabric IQ MCP server, row-level security then applies to the sharer's identity, not the viewer's.
- Dashboards that become important should move to Power BI reports or Fabric Apps, built on the same semantic model.
What does a certified query certify?
Dashboards can use extracts (files; CSV, JSON, etc.) or live queries to database sources. Certified queries and live sharing only work with live queries, which gives you a reason to connect dashboards to your semantic model instead of uploading extracts. For a semantic model, a connector sends the DAX query to the model. We used Microsoft's Fabric IQ MCP server.
A certified query is a live query deemed to be "the right query" for this data, and the certifier can specify query parameters for which they consider the results correct. A DAX query for revenue, for example, could allow passing a year to filter 'Calendar'[Year] and a customer to filter 'Customer'[Customer Name]. Each parameter has a rule for the values it accepts, such as a list of years or customers.
In the saved query, a parameter is a placeholder in the DAX text, and the value someone picks replaces it when the query runs:
EVALUATE
SUMMARIZECOLUMNS (
    TREATAS (
        {
            {
                {
                    year
                }
            }
        },
        'Calendar'[Year]
    ),
    TREATAS (
        {
            ""
        },
        'Customer'[Customer Name]
    ),
    "Revenue", [Revenue]
)
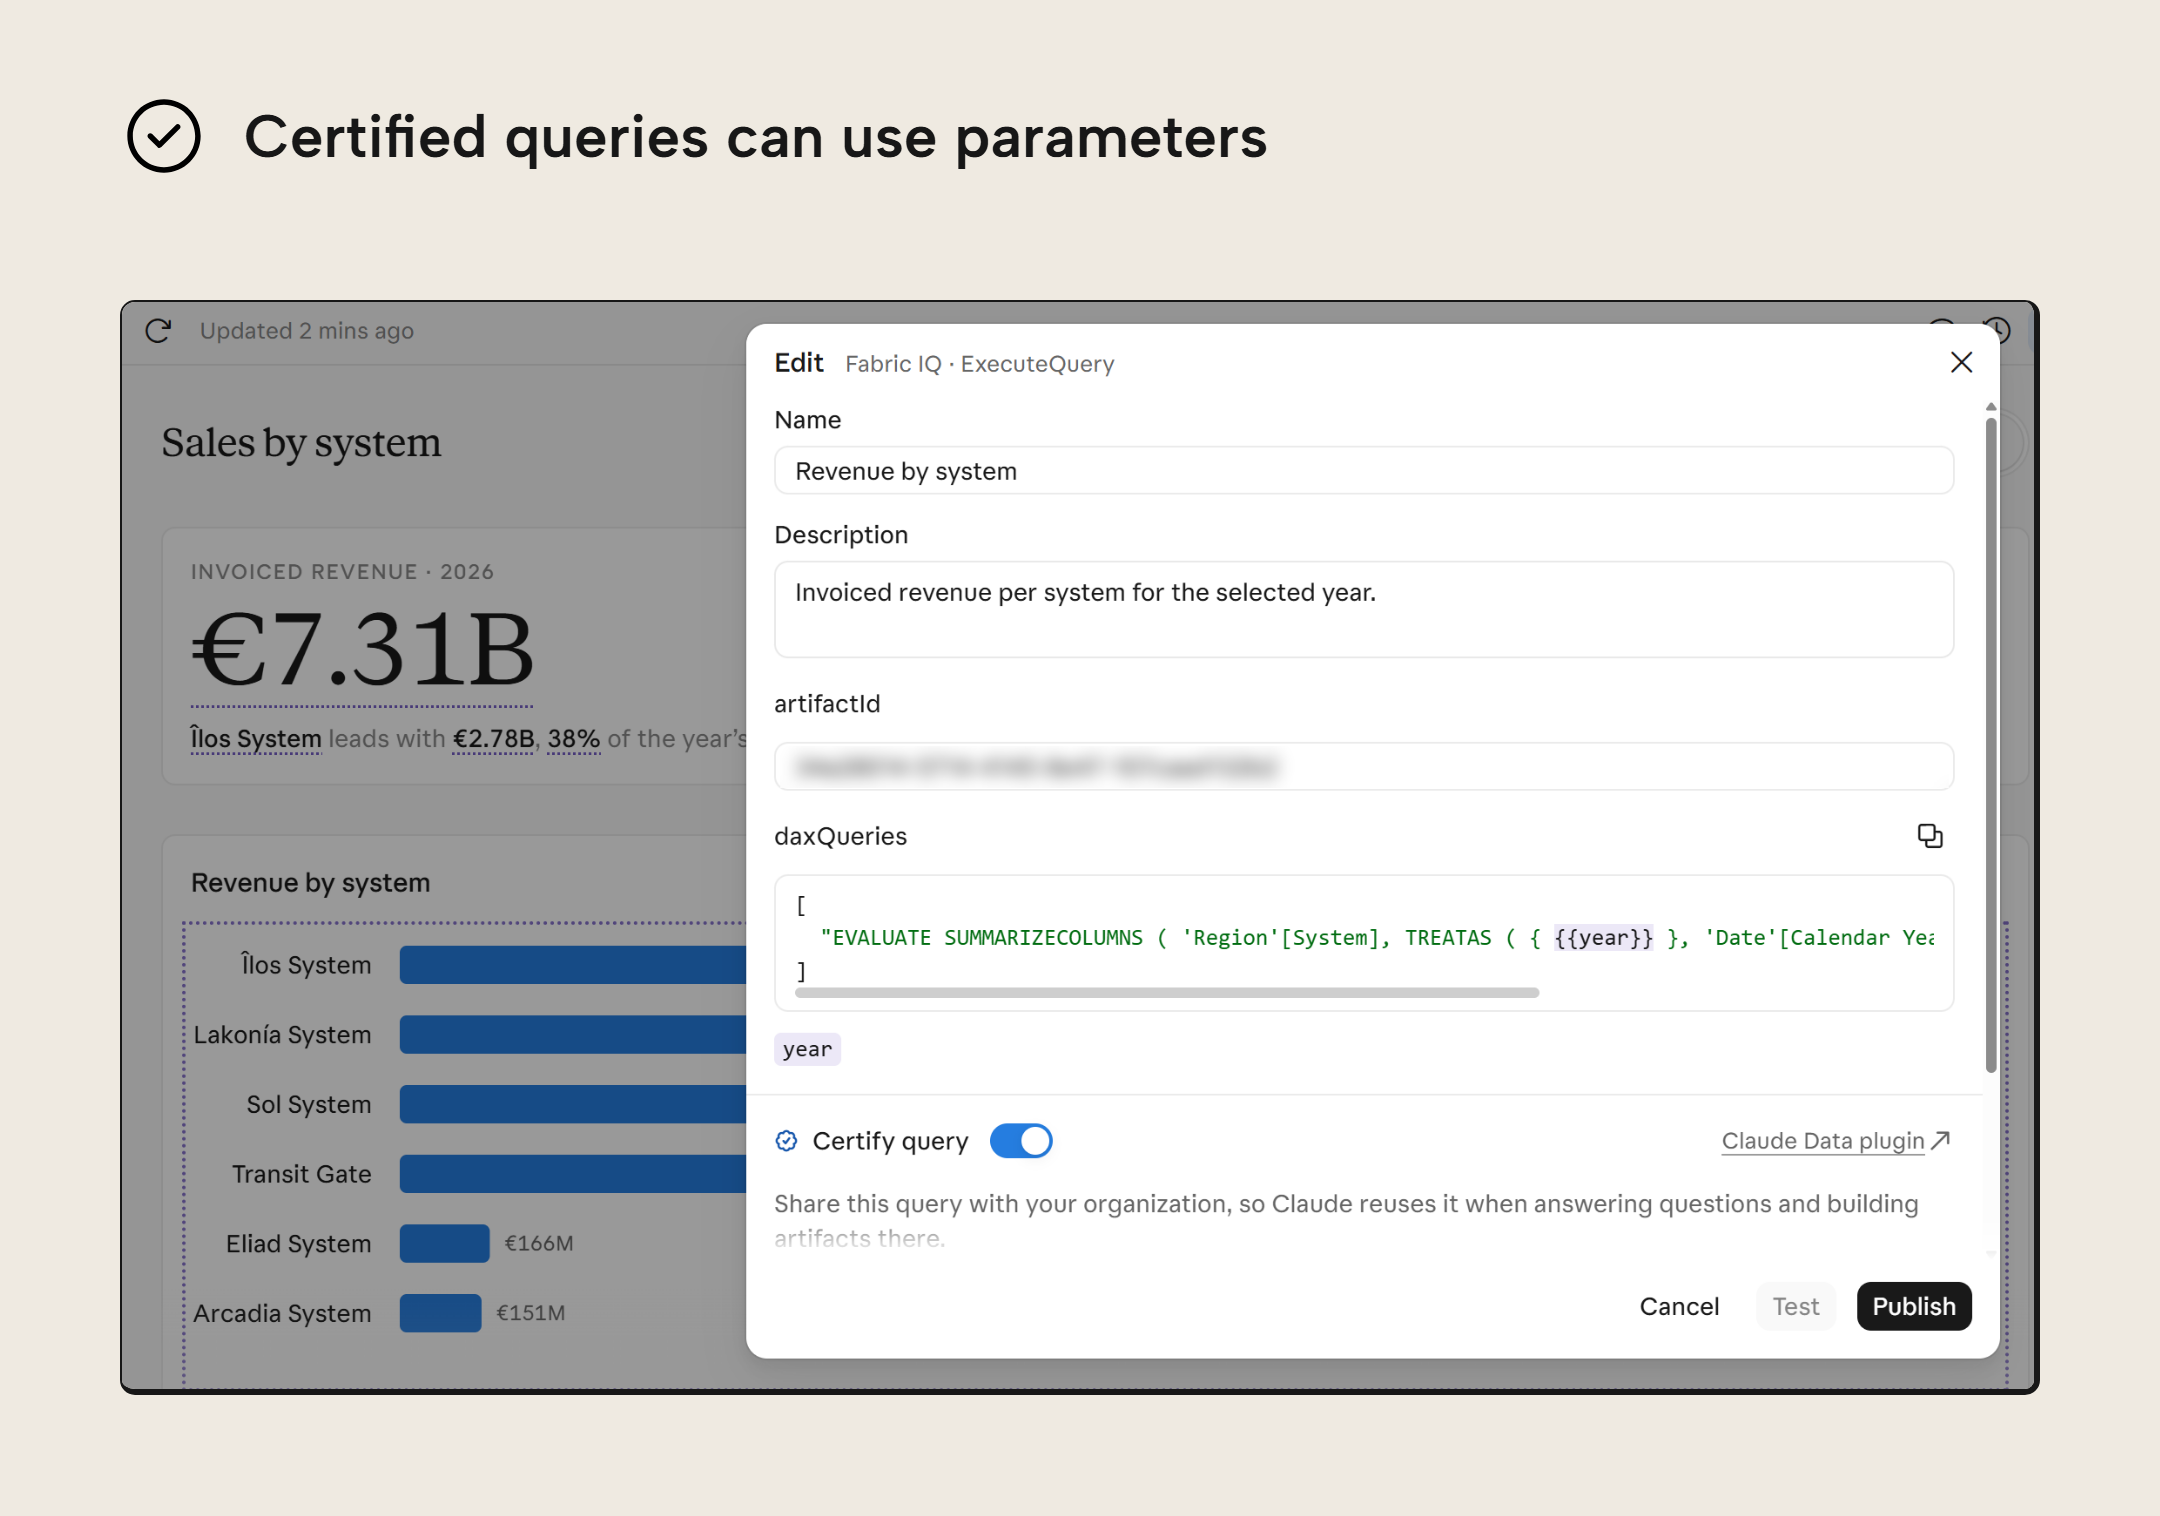
Certified queries don't replace a semantic model, but run on top of one; the measures of a semantic model apply under any filter or grouping that a report, API or agent can come asking for. A certified query only accepts values for the parameters the certifier allowed; any other filter or grouping requires a new query. Such a new query can use the same measures, so the semantic model still decides how revenue is calculated. In that sense, a certified query works like the query behind a paginated report: a fixed DAX query with parameters, built on the model.
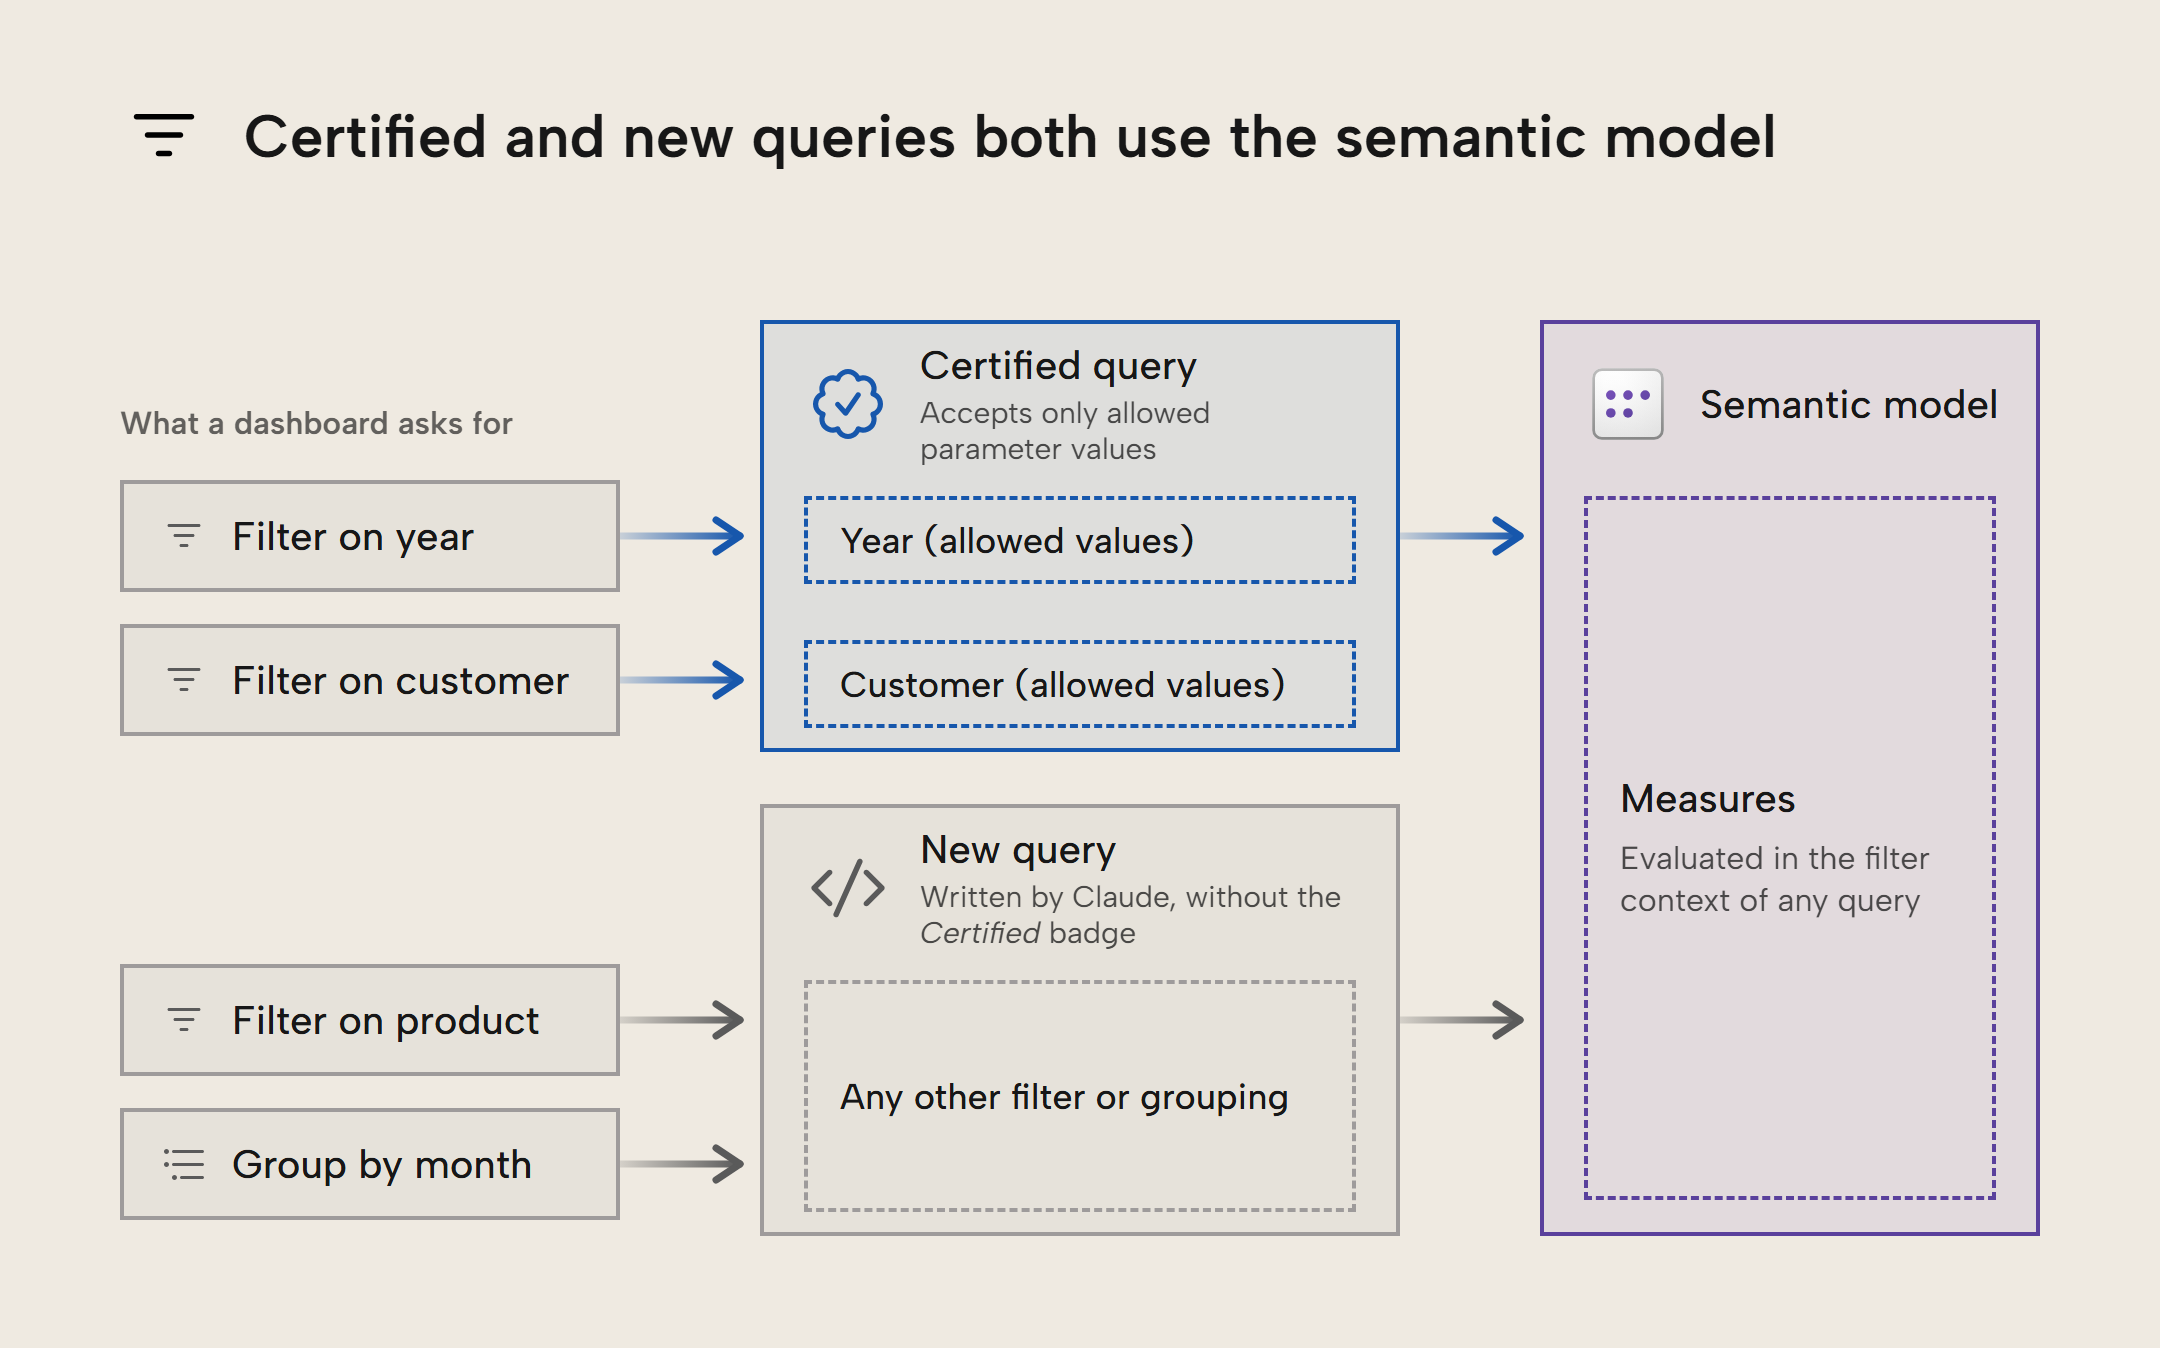
We think certification is mainly a discovery aid. A certified query is the one version among other similar queries that Claude and your colleagues should use, and certification in Claude Data works on a smaller scale than endorsement in Power BI and Fabric. You endorse a whole item, such as a semantic model, to tell everyone in your organization to use 'Invoiced Sales' over 'Invoiced Sales(1)'. You certify individual queries on that model to tell Claude and your colleagues which query to use for a question they often ask.
Certifying a query doesn't mean that any number or visual derived from it can be blindly trusted, however. A dashboard can do additional calculations on the query's result in JavaScript, such as a share of total, even when that wasn't the certifier's intent. The dashboard will show its Certified badge all the same.
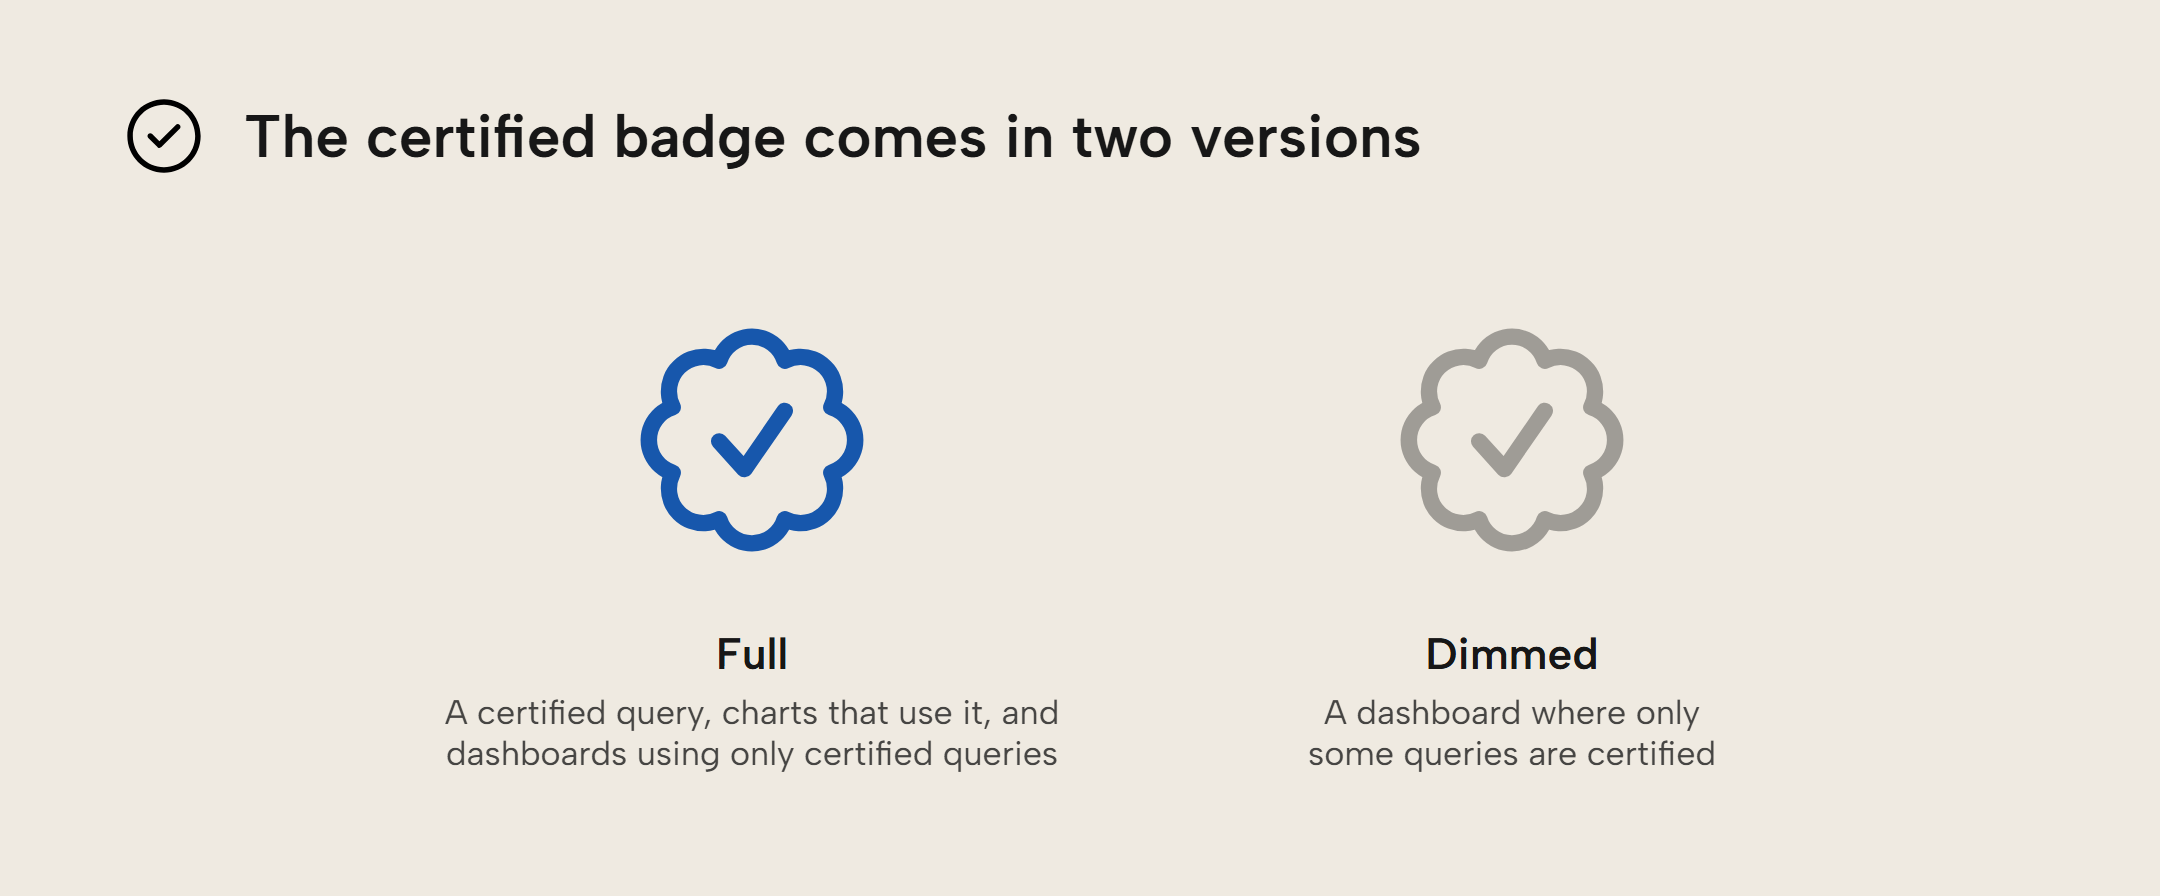
Those Certified badges show in three places: on charts built on the query, in the Sources pane (the pane that lists a dashboard's queries), next to the query, and in the dashboard's toolbar. In the toolbar are two types of badges: a dimmed one for dashboards that use some certified queries, and a full one for dashboards using only certified queries. Any text edits made to a certified query cost the query its Certified badge, and restoring the exact text brings back the badge.
You can make a Git repo the source of truth for your organization's certified queries (the docs say only some organizations can do this for now). This is good, because you should absolutely be able to see what a query's definition was three iterations ago, and require peer approval (pull/merge request) to change the definition.
NOTE
In our test, an editor wasn't able to certify queries and an admin could. The editor got told to ask an admin, while the docs say anyone with write access to a dashboard can certify. We also weren't seeing visuals carrying that certification badge if the query they represented was certified. And our Team organization could not choose a Git repository for its certified queries.
Live sharing data someone else should see
Live queries pass the dashboard viewer's identity along to the source, which may apply row-level security according to what that viewer has permission to see. With live sharing, editors can share the results of a dashboard's queries with a colleague, loaning out their identity.
That colleague can then see the same data the sharer sees, during the course of 90 days, and refreshed using the sharer's identity. They can also choose other allowed values for the query's parameters and rerun the query, with the sharer's identity. This makes a live share more like a file you share in Teams that expires after 90 days than like a published report (where the semantic model applies its row-level security for whoever views the report).
Editors can enable it per connector in the Sources pane, in a Viewers use menu:
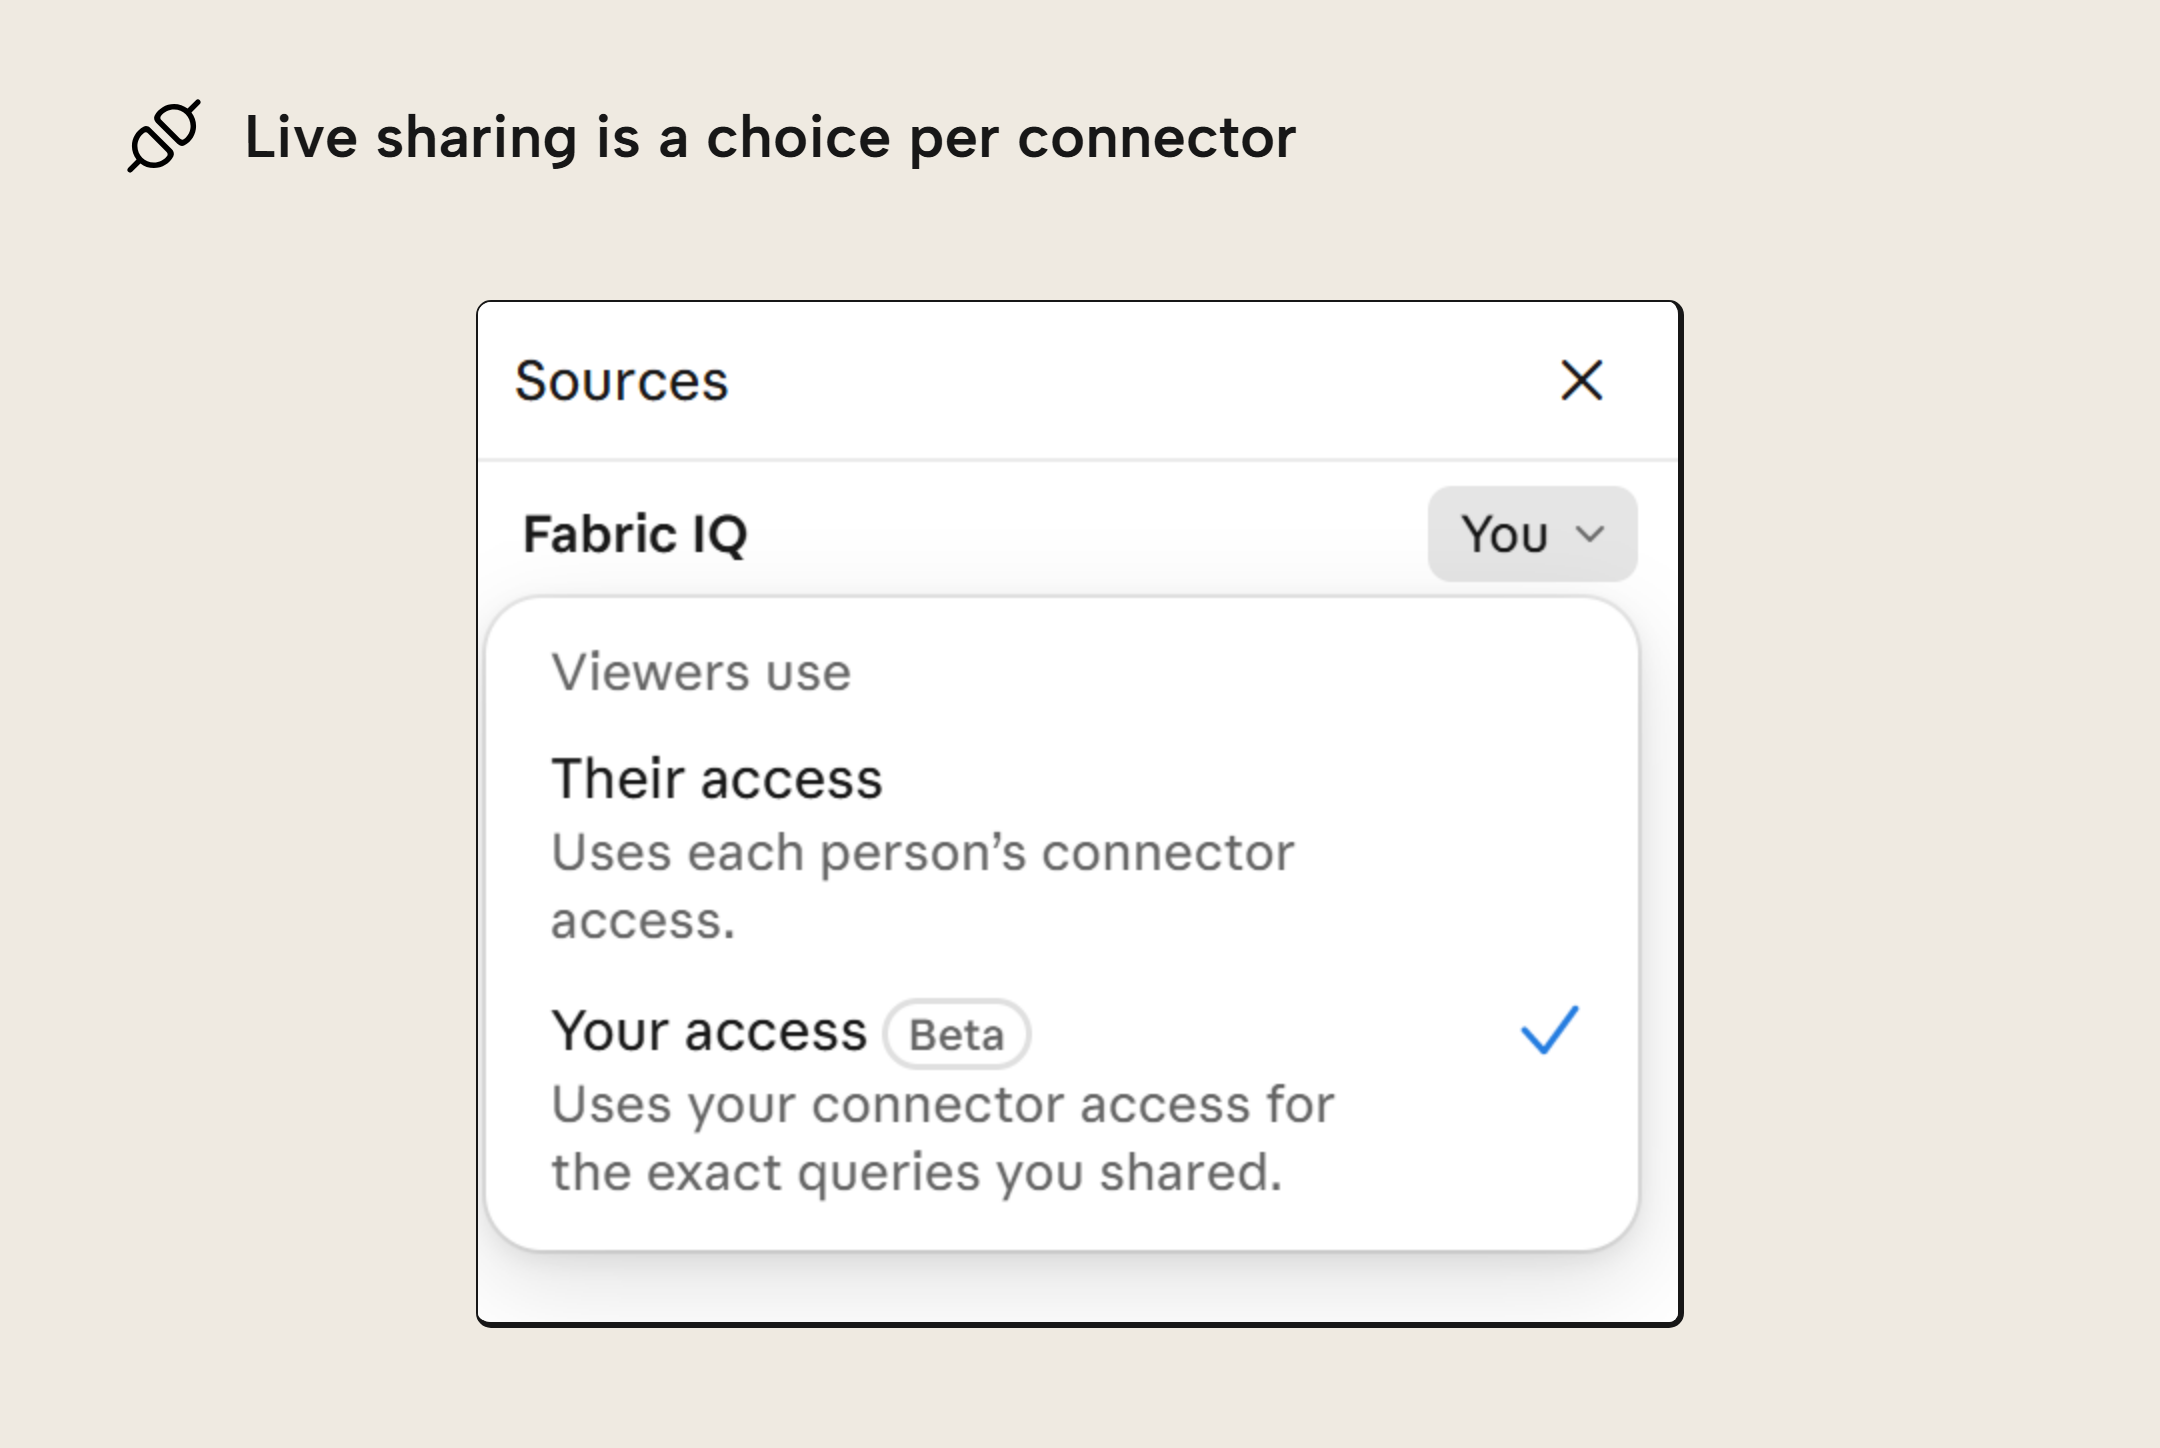
While very useful -- certainly more convenient than sharing screenshots -- it's an avenue for inadvertent leaks, especially if users aren't very aware of each other's permissions in the organization. At 5 dashboards and 50 users, this helps prevent screenshot spread. At 500 dashboards and 5,000 users, this can show someone data they weren't meant to see. At that scale, it helps that admins can list every shared Claude Data artifact with its owner and who can see it.
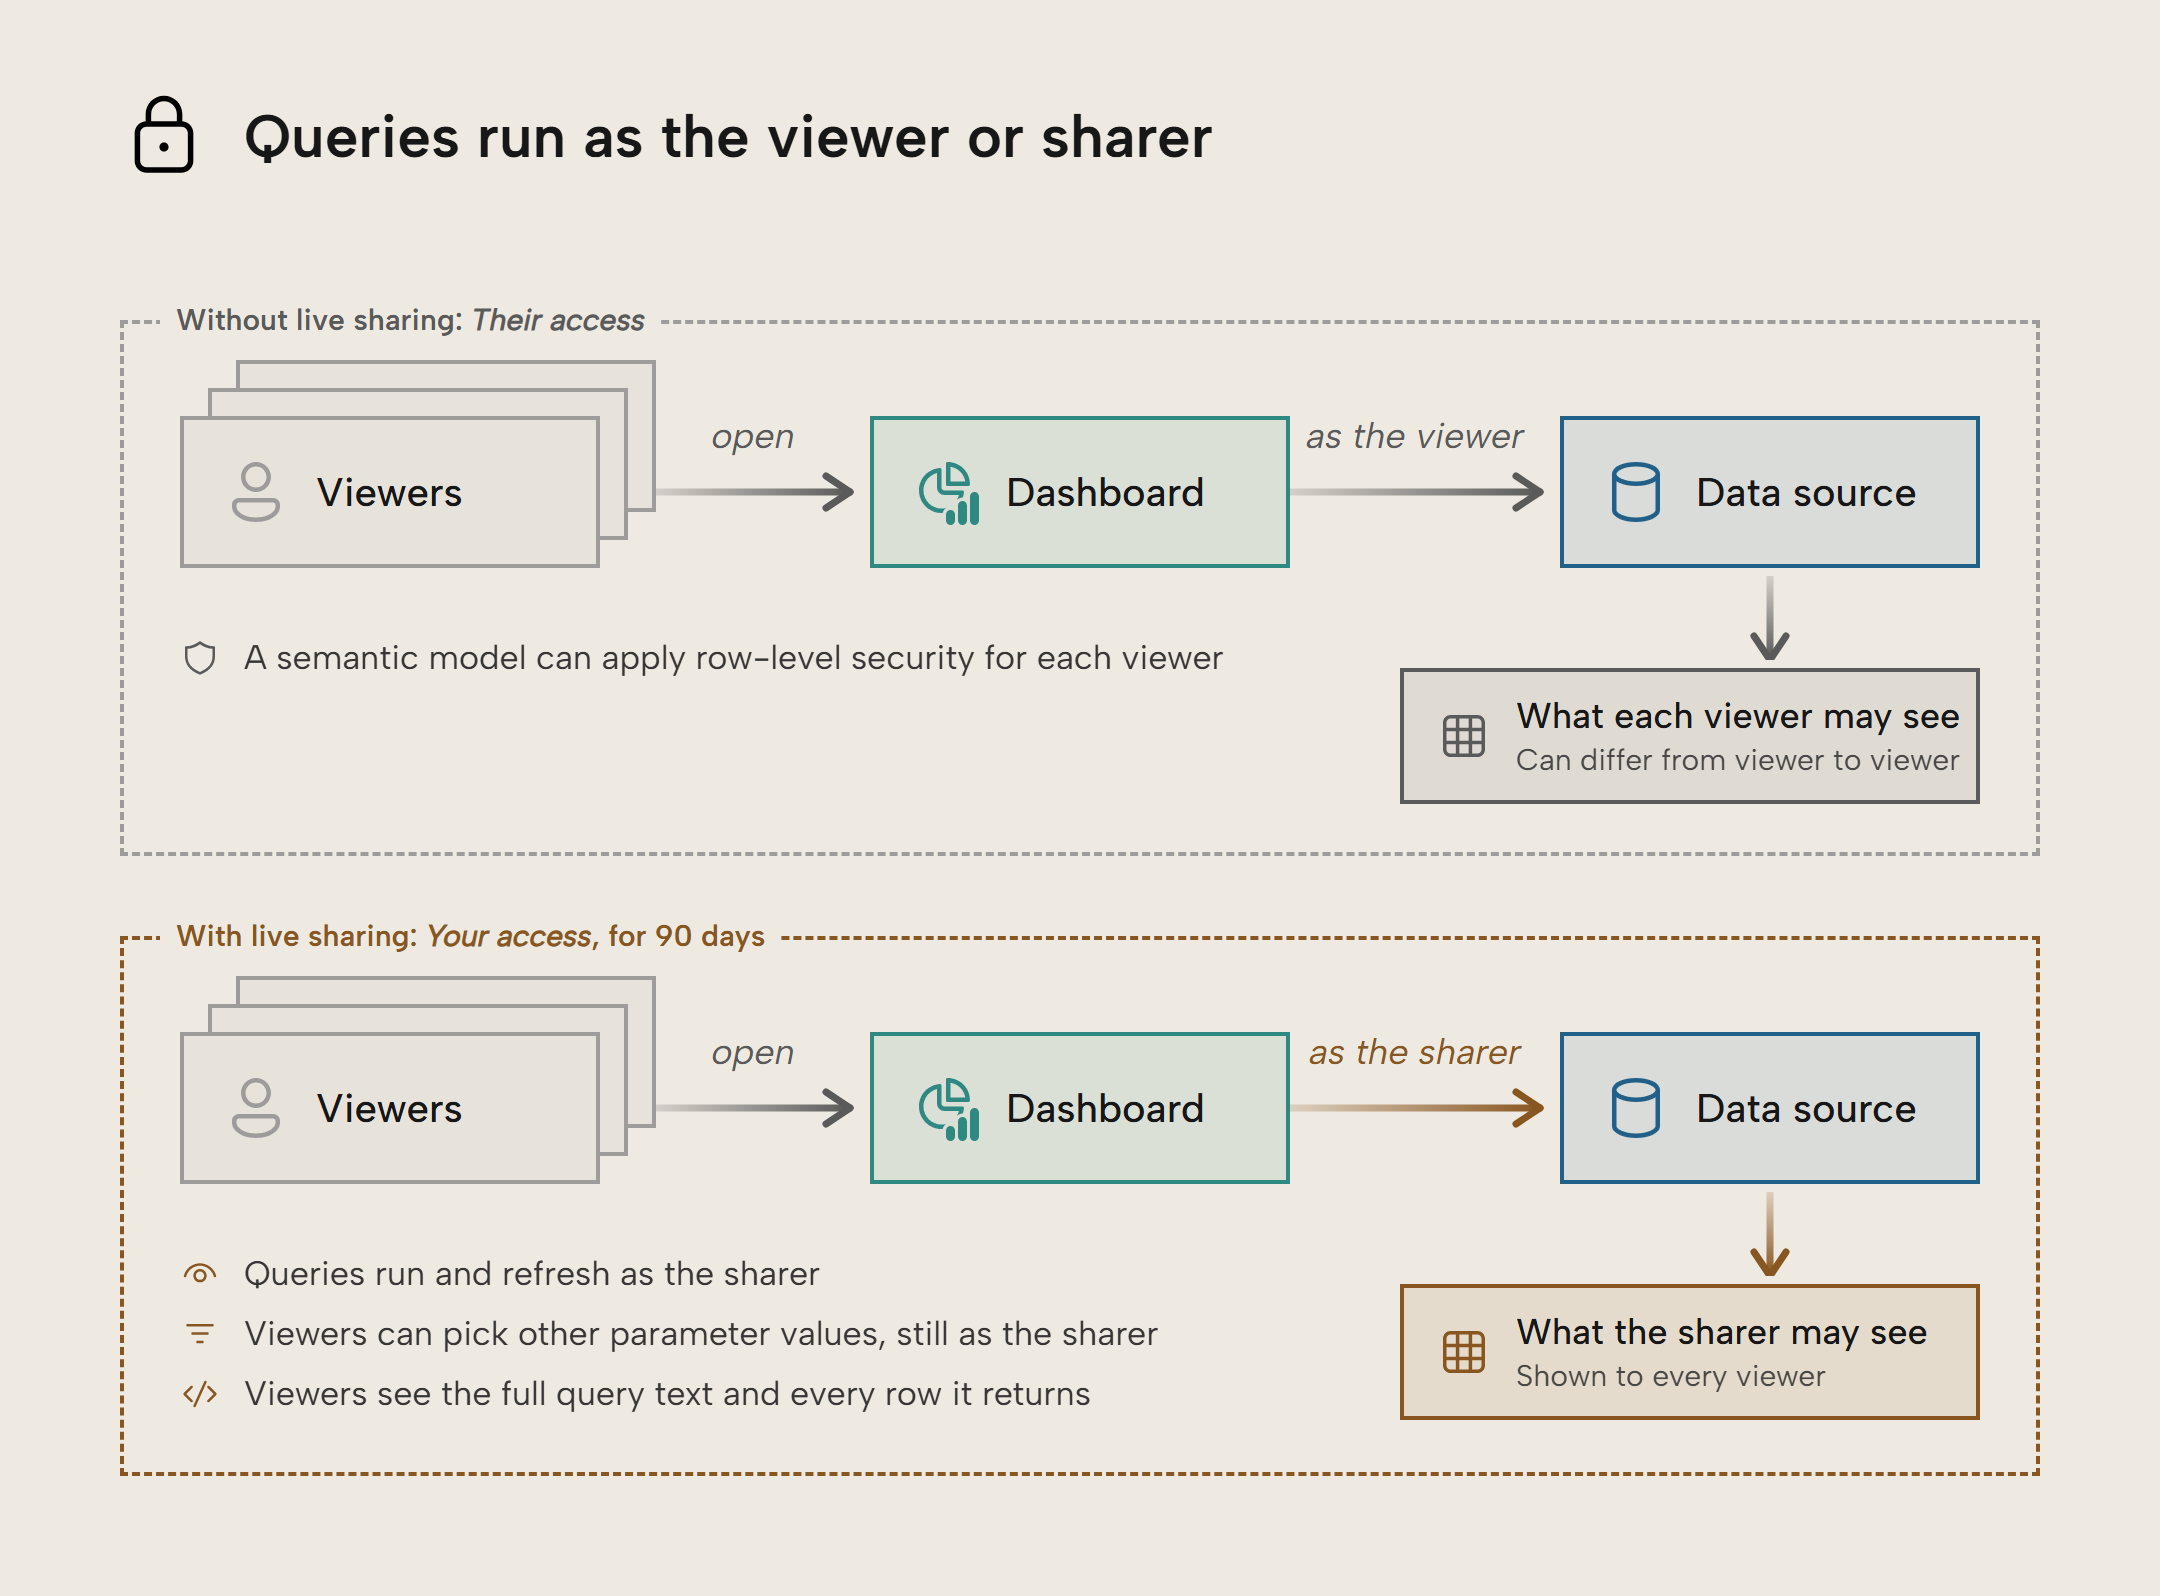
Use Your access for data that you know may be passed on to the people you share with, and keep Their access where the semantic model's row-level security should decide what each viewer sees.
NOTE
A shared query's parameter rules are the only limit on which values a viewer can send with your access. The Share screen currently does not show those rules, and a rule you tighten only takes effect after you press Share again.
Design system for a consistent look
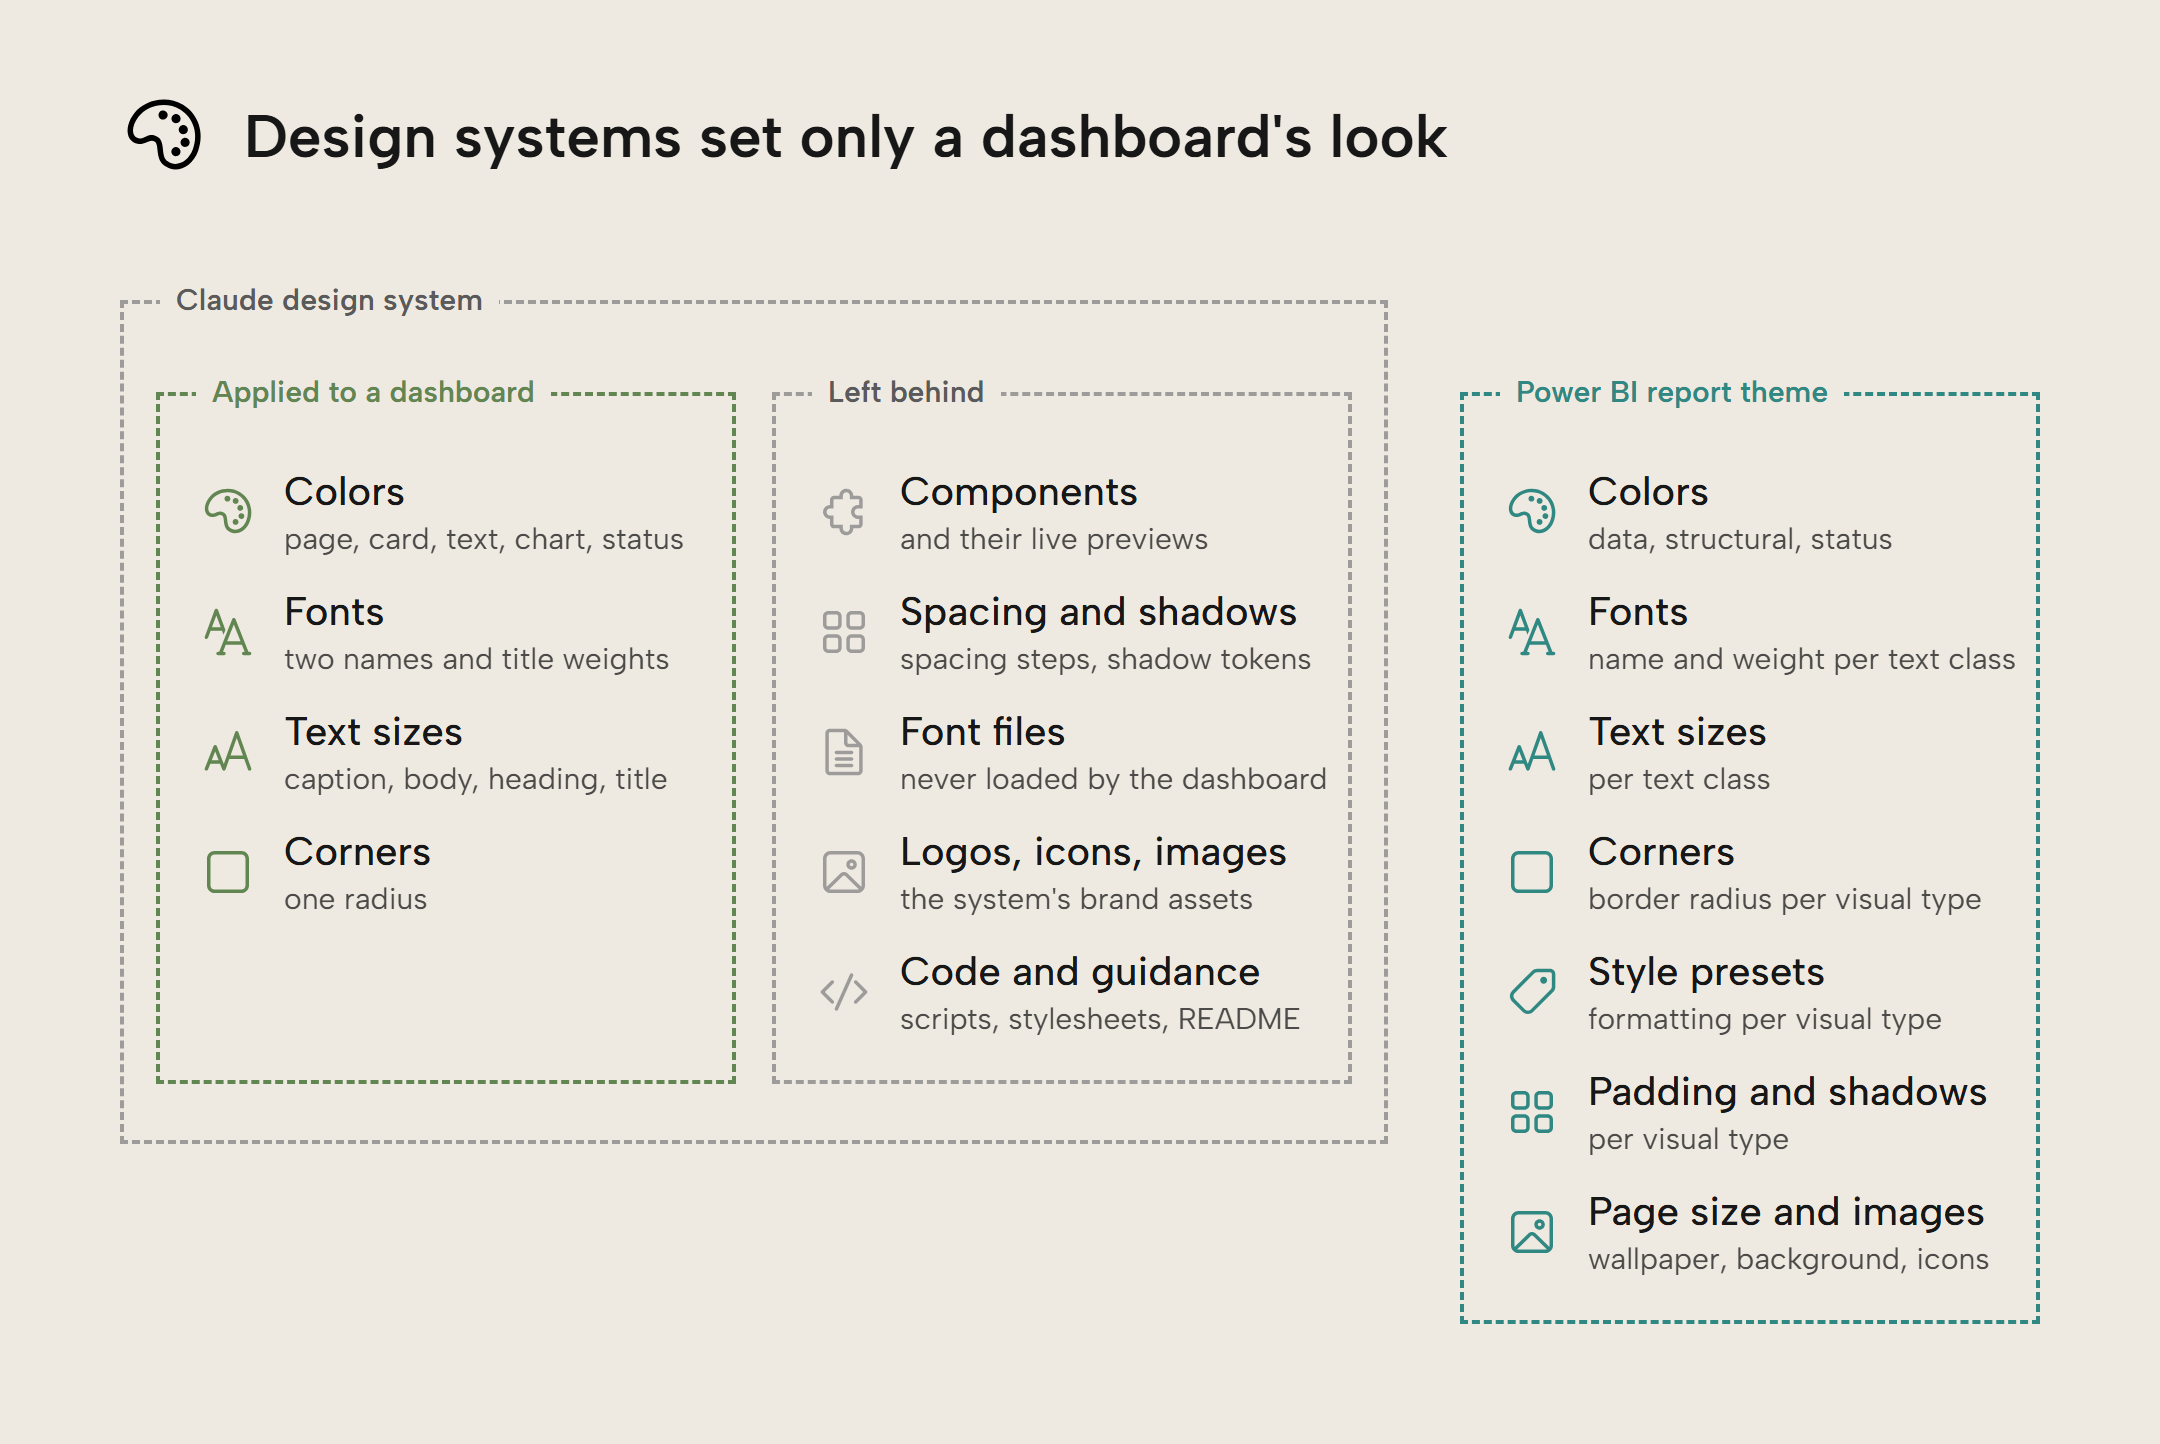
For a while, we had Claude Design as a separate app at claude.ai/design. It has since moved from a separate app into Claude. Now, the design system artifact can apply to other artifacts such as Slides, Designs and Claude Data dashboards; this goes broader than the report themes you can only apply to Power BI reports.
Applied to dashboards, the design system sets a consistent look: colors, fonts, text sizes and corners. But dashboards need more; they are interactive experiences where users arrive with expectations from the tool(s) they know: on a touch screen, a Power BI user taps and holds a bar to see its tooltip, while a Tableau user expects a short tap to select the bar and show the tooltip.
Without the prompt specifying how UX should work, any agent (not just Claude) will come up with the patterns it thinks make sense for that dashboard. Across agent sessions and dashboards, subtle differences in interaction patterns can sneak in, such as those between Power BI and Tableau. Applied to 50 dashboards, this becomes a UX Tower of Babel where users don't know how the dashboard at hand will behave. At best, this is a discomfort. At worst, it causes misreadings because the visual wasn't cross-filtered as the user assumed, and they were looking at the total instead of the part.
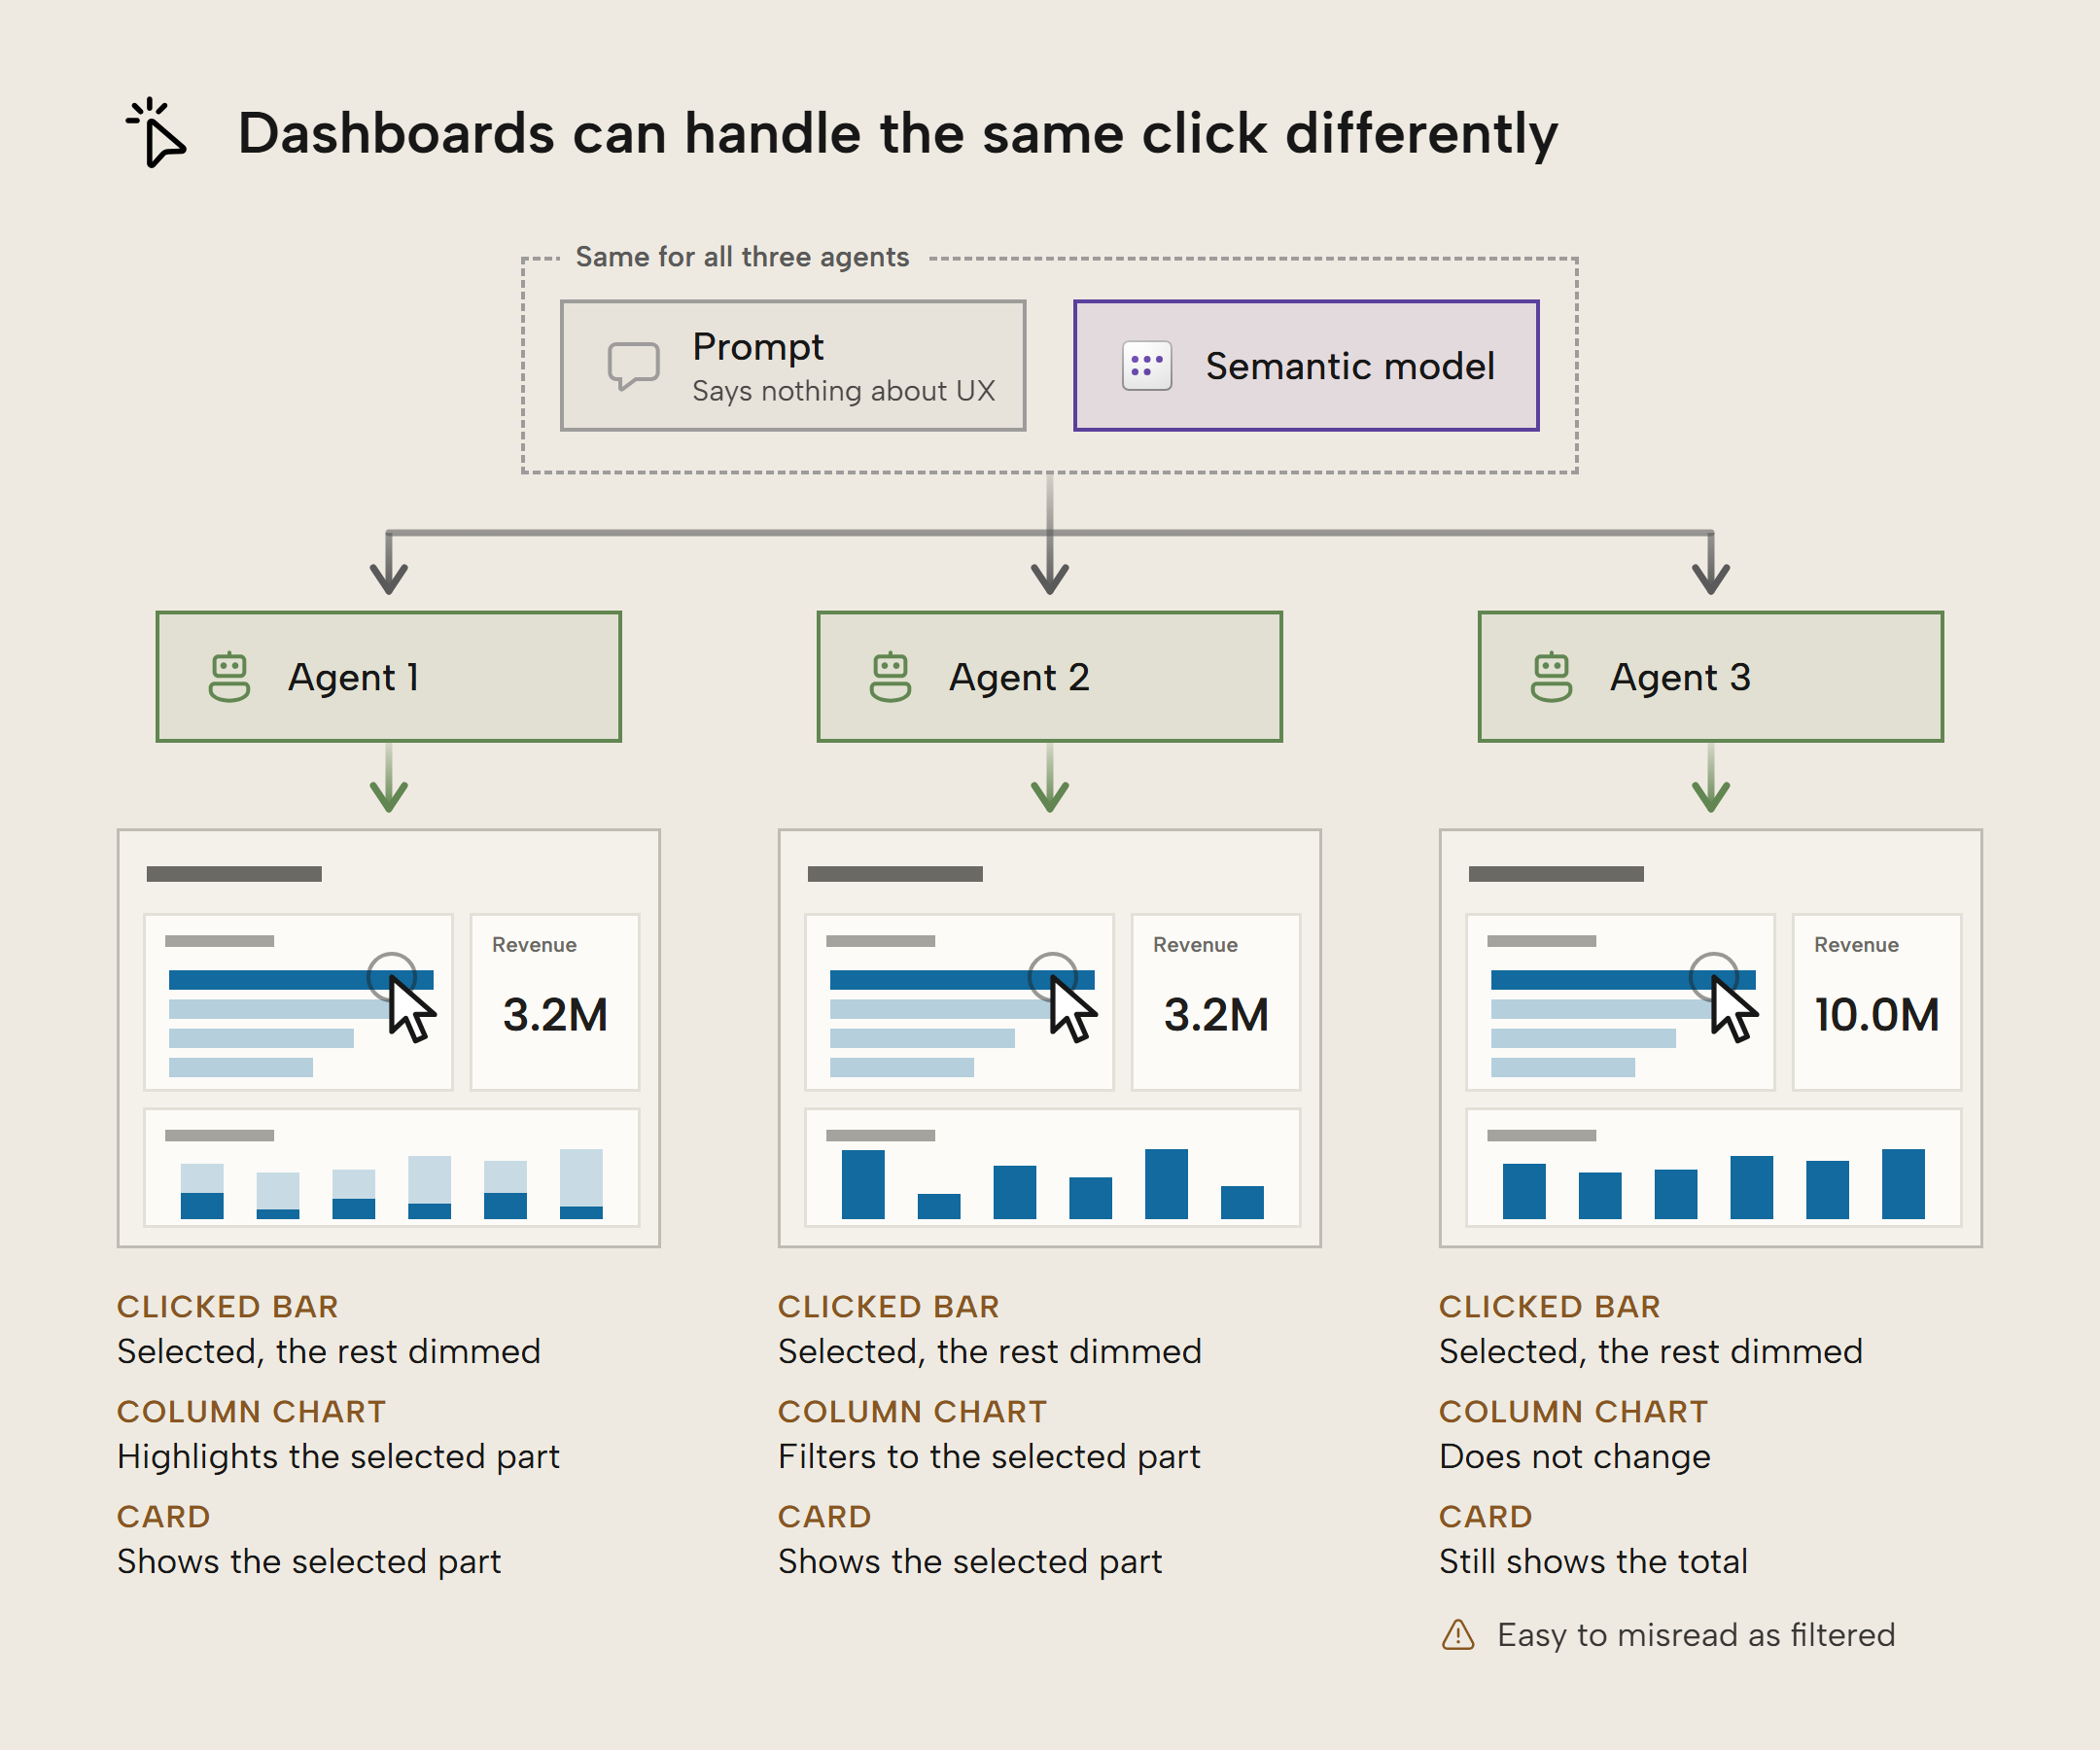
A design system should specify these interactive components, too. In its current form, the design system applied to dashboards is more of a theme than a real system. Decks and designs already capture components, so it's not far-fetched to assume that design systems can also carry them for dashboards. Until then, you should consistently describe the interaction patterns you want in prompts asking for a dashboard.
NOTE
An Owner or Primary Owner can make one design system the organization's default for new artifacts. In our test, applying a design system copied its values into the dashboard, so a later change to the design system only made its way to the dashboard when someone applied it again.
Where does Claude Data fit, and what does it tell us?
Claude Data is starting to feel like a player in the self-service, low-code/no-code space. Anthropic is making it easy to build for non-developers, and there's just enough governance to make it palatable for businesses to adopt. To be clear, we've seen little evidence that Claude is making a Fabric, Databricks or Snowflake replacement or that Anthropic wants to get into the generic hosting business.
They do, however, seem to be interested in white-collar work, invested early in Office add-ins, and they want Claude to be the place where you do your work. In their amended S-1 filing (a document filed with the United States' Securities and Exchange Commission in preparation for going public on the stock market), they put it this way: "As customers build on the primitives we provide, Claude becomes an integral part of their data, workflows, and institutional knowledge, and the relationship deepens with each integration."
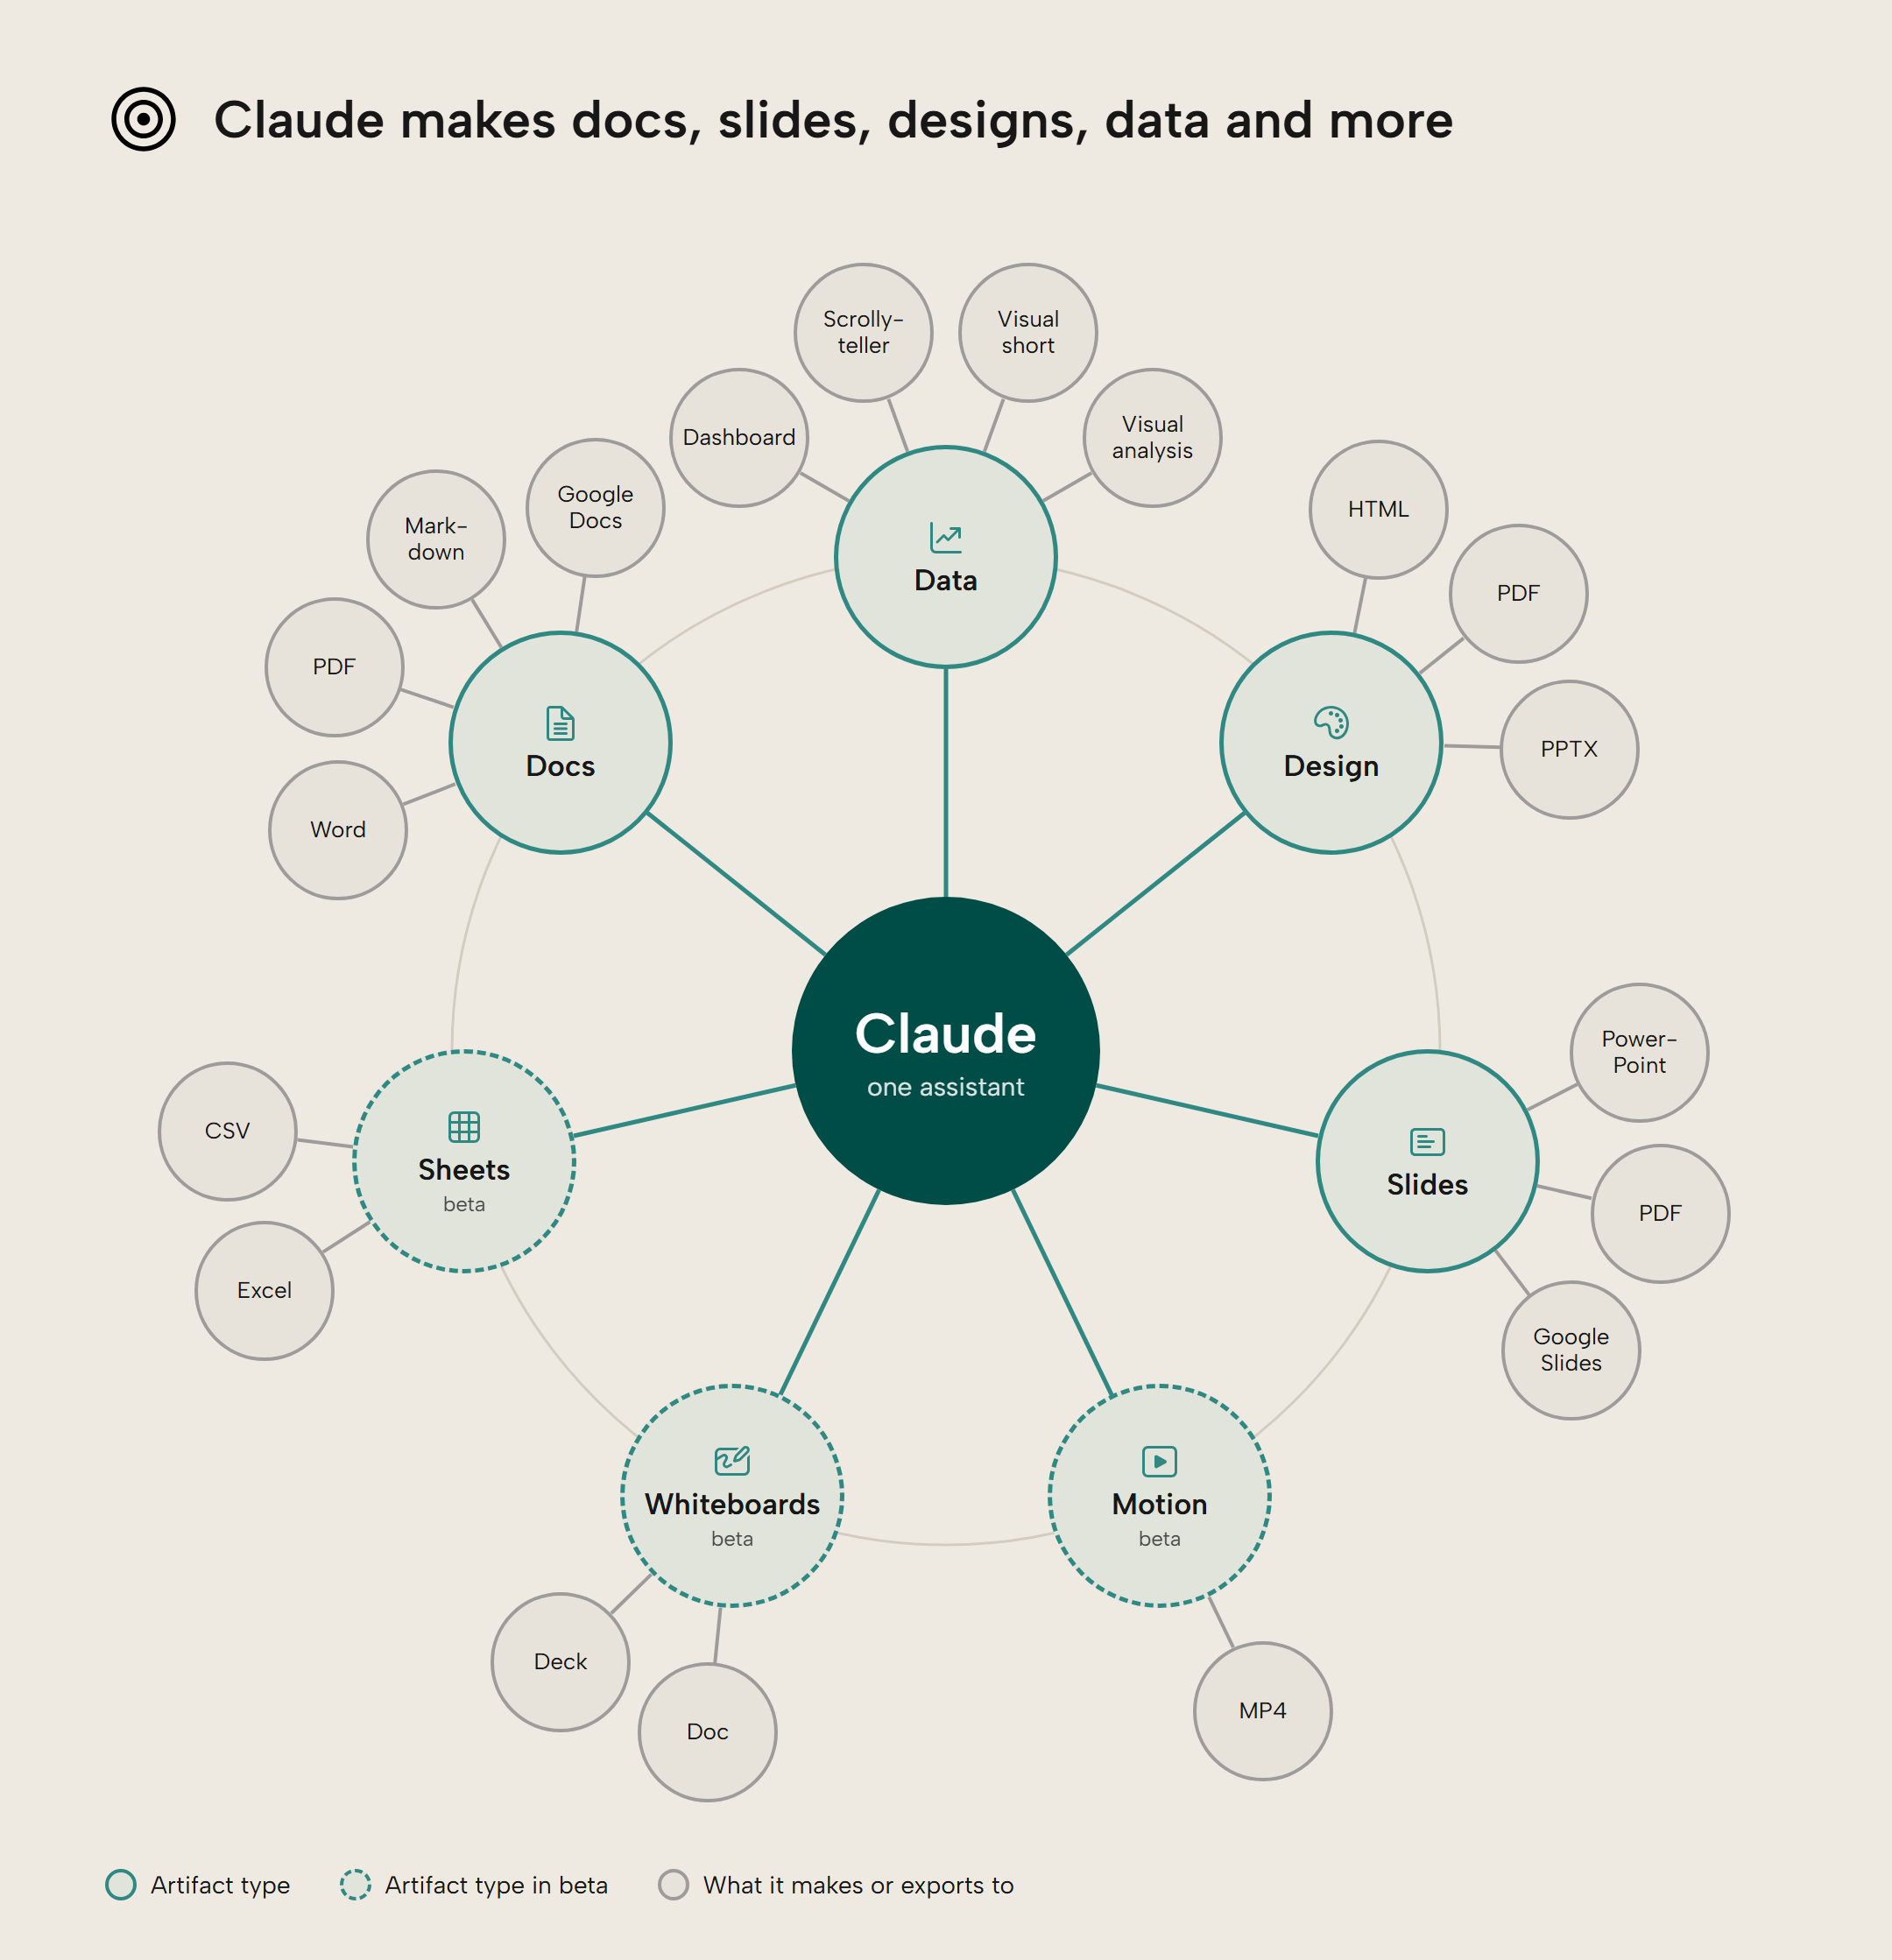
Organizations have had to choose between centrally governed reports, managed self-service, and everything in between. Many organizations split the choice: the semantic model is built and governed centrally, because the numbers have to be right, and self-service mostly happens in reports. Claude Data makes the self-service end bigger and faster, and makes ad-hoc and throwaway analyses much easier. If you're in the governance seat, that leaves you with more decisions about which analyses are fine to do in Claude Data, and when a dashboard should be promoted to something more official such as a Power BI report or Fabric App. Decide too which data Claude can reach (and where it then travels and resides, since zero data retention currently does not cover Claude Data), for example through Microsoft's Fabric IQ MCP server.
Right now, Claude Data has gaps that keep it at the lowest tier of our report CI/CD maturity ladder: version history but no built-in source control for dashboards, and no way for a pipeline to publish a dashboard (only a signed-in Claude session can). We think exploratory and personal dashboards can live in Claude; dashboards that become important belong in Power BI reports or Fabric Apps, built on the same semantic model.
Further Reading
- What are Claude Dashboards? Analyzing and visualizing data with Anthropic's Claude.ai (Tabular Editor). Our first look at Claude Dashboards in October, before the rename: connectors, live queries, the Sources pane, and how dashboards compare with Fabric Apps.
- Introducing Claude Whiteboards, Claude Sheets, and Claude Data (Anthropic). Anthropic's announcement of the rename and general availability, with certified queries and live sharing in beta.
- Get started with Claude Data (Anthropic). How to certify queries, share live results and restore an earlier version, including Anthropic's own warning about sharing results on your access.
- Endorsement overview (Microsoft Learn). How promoted, certified and master data badges work for Fabric and Power BI items, for comparison with certified queries.
Conclusion
Claude Data is not just a rebranding of Claude Dashboards; there are new features that close some of the gaps, and align with Anthropic's ambition to become part of your business stack. Certified queries can point Claude to approved queries on your semantic model, and live sharing lets you show a number to a colleague who has no access to the model without sending a screenshot that goes stale. Version history lets you restore an earlier version after a bad edit, and a design system gives every new dashboard your organization's look.
We think exploratory and personal dashboards can live in Claude; dashboards that become important belong in Power BI reports or Fabric Apps, built on the same semantic model. Whichever front-end you use, its data should come from your semantic model, where well-defined measures keep Claude Data's queries (certified or not) and your reports consistent with each other.
Take your semantic models further with Tabular Editor.
Give Tabular Editor a spin