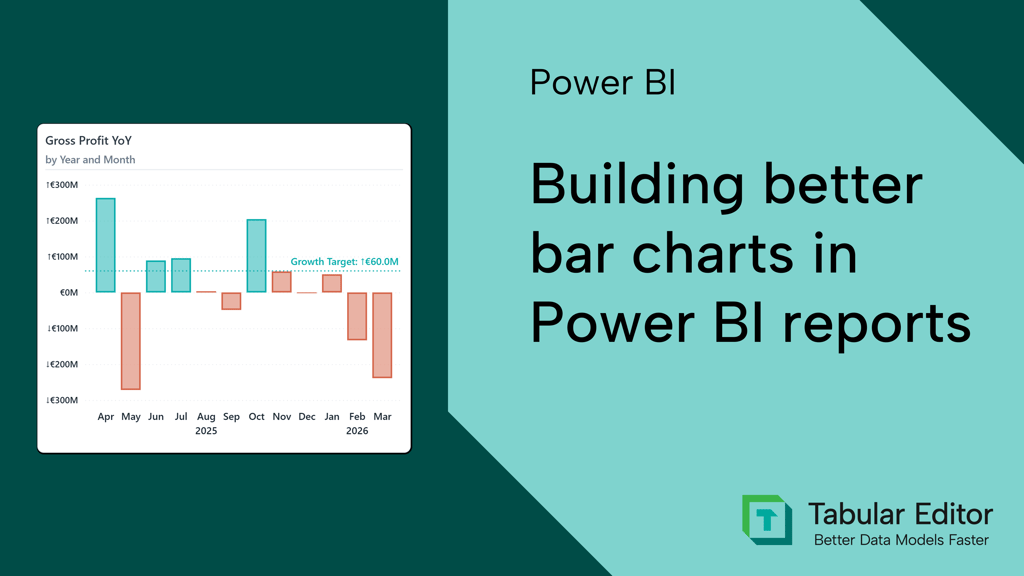
April 28, 2026 Building better bar charts in Power BI reports: a comprehensive guide Power BI Dashboard Design Data Visualization Power BI Report Key takeaways Bar charts just work: Length on a common baseline is the most accurate encoding for magnitude, and the format is widely... Read more
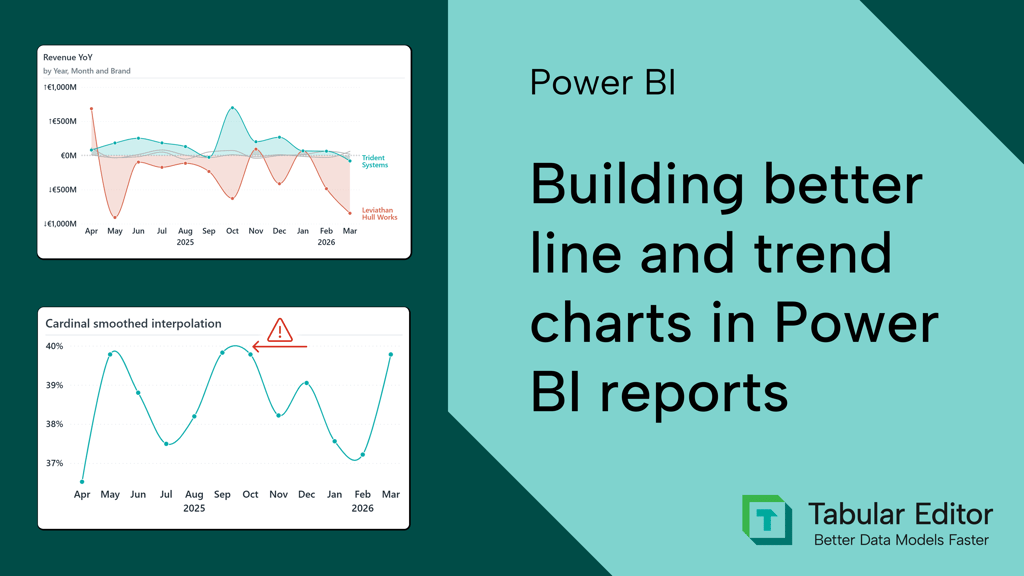
April 14, 2026 Building better line and trend charts in Power BI reports Power BI Dashboard Design Data Visualization Power BI Report
March 31, 2026 Interactive data visualization in Power BI reports Power BI Dashboard Design Data Visualization Power BI Report
February 24, 2026 Make better tables and matrixes in Power BI reports: a comprehensive guide Power BI Dashboard Design Power BI Report
October 21, 2025 How to improve a month slicer for your Power BI reports Power BI DAX Dashboard Design Data Visualization
August 15, 2025 How dashboard design helps you make better semantic models AI Semantic Model Dashboard Design