
Key takeaways
- The prompt is just one input: An LLM's output quality also depends on the model's structure, its documentation and annotations, grounding anchors, and the examples it can pattern-match against.
- Good inputs, better outputs: Hallucinations, wasted tokens, and confidently wrong answers are downstream symptoms of thin or conflicting context.
- The work is dual-purpose: Cleaning naming, filling descriptions, documenting edge cases, and hiding what nobody should use helps the next human and the LLM alike.
With thanks to Kurt Buhler for his contributions to this article.
Ensuring “AI readiness” for semantic models
“AI” has become a moving target, and tomorrow the term may mean something else. In this article, when we say AI, we mean Large Language Models (LLMs) specifically: whether running under Copilot in the Fabric UI or driving third-party coding agents like Claude Code. When we say “model”, we mean the semantic model, not the language model. We’ll use the broader term “AI” throughout for readability, but the behaviors and trade-offs below are LLM-specific. Where humans fill gaps with prior knowledge and assumptions, LLMs fall back on patterns learned during training or hallucinate plausible completions based on what’s in context.
The principle also applies to Fabric semantic models. An organization’s definition of revenue probably includes specific filters, timing rules, and exclusions. Though the logic may not be written down in one place, the human analyst has absorbed the logic through their experience working with data in the organization. They can often spot a number that is off and assume it’s off by that magnitude because a specific filter wasn’t applied, and debug with a clear direction. The LLM without knowledge of the revenue logic, it’s not in the training data, nor available on the public web (hopefully), must assume the number is correct or hallucinate plausible-sounding logic that doesn’t match the organizational reality.
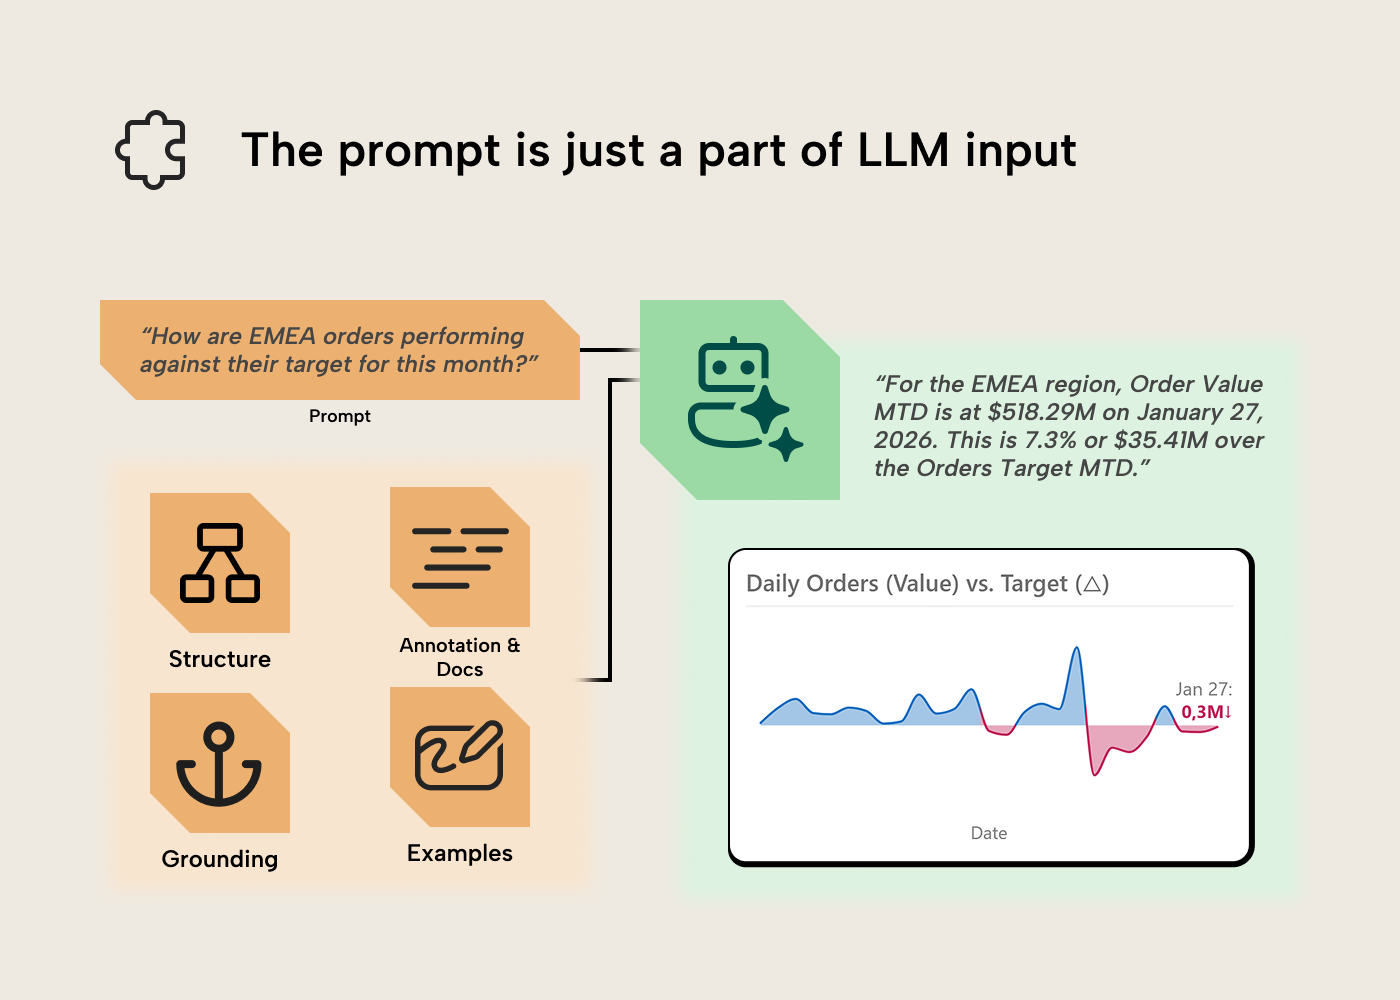
Bridging this gap means making the implicit knowledge explicit, the role a semantic layer has always played, with AI raising the stakes. Not for LLMs alone, but for every new analyst or future you revisiting the model in six months. The optimizations we can make to enhance LLM output often overlap with improving UX for human users interacting with semantic models. You may have heard of “prompt engineering” before, but the prompt is just a part of the input for the LLM. Let’s discuss the other parts.
Step one: Meet and discuss with business users and stakeholders
A good semantic model starts with understanding user needs and abilities. True with AI or without; a good semantic model lives and dies by how well you’ve understood the business area and requirements, then translated that to a good model design. See our guide on gathering requirements for a semantic model for more.
Regarding Copilot, data agents, and other conversational BI tools, there are some special activities that you need to keep in mind here, including:
- Understanding which users want to query data with natural language, and why. This helps you understand whether there’s a specific audience in mind for the experience, and what their expectations are. Here it’s essential to set the appropriate expectations with users to facilitate adoption. For instance, users typically expect these experiences to produce text, tables, and visuals in their responses. Copilot in Power BI generates visuals directly in the report canvas; Fabric data agents return text and tables, and chart rendering happens in whatever host surface the agent is embedded in, not in the agent itself.
- Understanding how many users want to query data with natural language. Optimizing a semantic model for use with AI does take significant time and effort. This is true mainly regarding user adoption and training, and curating context like AI instructions or descriptions. If interest in AI tooling is coming from a handful of vocal stakeholders or executives, this helps you tune your approach to avoid over-investment.
- Defining the types of questions and analyses users want to do. When using AI, users can’t see what data is or isn't available in the data source. This often results in them asking questions that aren’t possible to address with the scope of data available, which can lead to results that appear incorrect as the tool attempts to give an answer. It can also create confusion, since AI tools will use ad hoc DAX queries to derive an answer if no measures are available. These queries can use calculations that aren’t standardized, so two users could get slightly different “correct-seeming” results, consequently.
- Determine users’ experience and skills with AI, and whether they need training (hint: this is new; everyone does). Most users have little to no experience with AI outside of basic encounters with ChatGPT or Copilot. They need training on basic concepts like nondeterminism and prompting, as well as how to navigate the UI/UX of these tools, which is likely completely new to them, compared to reports, dashboards, and pivot tables.
- Determine the change management you might need. Users need to understand when to use conversational BI tools instead of (or as a complement to) reports, dashboards, and pivot tables. Even experts struggle with this, as many people try to use AI when a traditional tool would be better or more efficient. In contrast, many people also try to cultivate complex, exploratory reporting experiences, when this can be better supported with Copilot.
- Determine which conversational BI tooling you need for this scenario. Once you understand your users, their abilities, and their needs, you can make some decisions. The first decision you need to make is how they’ll query semantic models with natural language: Copilot, data agents, or a custom solution that involves the data agents SDK, AI Foundry, MCP servers, or APIs? Note that this article focuses on the first two approaches.
This applies to existing models being upgraded for Copilot or data agents, not just new ones.
NOTE
It’s essential that you work with and train users when you intend to deploy AI analysis tools like Copilot or data agents. Implementing these tools without adoption efforts is a recipe for disaster. This is something we’ve learned time and time again with various BI tools, and it’s certainly not new with AI: don’t underestimate adoption! See the Fabric Adoption Roadmap for a deeper treatment.
Step two: Design and build a solid, structural foundation for ALL analyses
To get good results from a semantic model with or without AI, you always need:
- Data quality: Accurate, complete, and trustworthy data from a source system that is handled appropriately during extraction, transformation, and loading (ETL; i.e. without loss, manipulation, or obfuscation). If you put in bad data, you get out bad results. A common example is having missing keys from a dimension table, resulting in referential integrity violations (and Blank appearing in Power BI reports and queries).
- Functional semantic model design: Tables and relationships have to be set up in a way that facilitates the analysis and avoids ambiguity. Ideally, your model is a star schema. If data doesn’t have the right structure or tables aren’t related in a functional way, then you can’t get the right aggregations. A common example is properly using a date table and avoiding bi-directional relationships (unless there is a good reason to use one).
- Functional DAX: Calculations that will return accurate and expected results with reasonable query times. If calculations aren’t functional then you get wrong results, or queries are slow or timeout. A common example could be forgetting KEEPFILTERS when you need to preserve existing filters alongside a CALCULATE override, or filtering tables rather than columns.
- Appropriate data security and permissions: Much of the time you need to share your semantic model with others for them to use it. If you set this up the wrong way, either with incorrect roles, filter expressions, or permissions in the workspace, then people might get access to data that they shouldn’t be allowed to see or use. A common example is giving someone member or admin workspace roles rather than access via an Org. App, viewer role, or read and build permissions, directly.
None of this is novel, but it’s still challenging to do well; it takes time, effort, and good requirements. The above applies irrespective of how you consume your data, via AI or otherwise.
Step three: Polish and ensure your model works well
Model optimization is also an essential task for your model to work well with or without AI. This isn't just to ensure that your queries and refreshes perform well and your model doesn’t exceed memory limits in Fabric, but also to ensure that AI and agents can find the right information to answer user questions accurately.
TIP
These tips are a subset from articles we’ve written in the past like Power BI for Beginners: 7 mistakes you don’t want to make and Power BI report optimization for beginners.
Many of these same optimization tips are also relevant for AI.
- Remove tables and columns you don’t need: You can always add these later. Too many tables, columns, and other objects in your model make it difficult for an LLM to find the right information to produce a query and increase the likelihood that it selects the wrong field (or makes other mistakes). To elaborate, consider removing a table or column if:
- You won’t use it.
- You can disable load for the table without impacting measures and reports.
- You can compute it in a measure (and it doesn’t need to be in memory). An example: you can performantly compute Sales Value by multiplying Quantity and Price, so you don’t need to store a third Value column. Avoid redundancy: when the same value lives in more than one place, e.g. a dimension attribute denormalized into the fact table. The model pays in memory and the LLM pays in a second field to disambiguate. Keep the canonical version (usually the dimension) and let the relationship surface it elsewhere. If two fields look similar but actually represent different concepts, that’s a naming problem, not a redundancy one. Fix it with clear naming conventions (see the Structure section of step four).
- Filter rows that you don’t need: Ensure that you limit tables to only the data that you will report on. A common mistake is to include a lot of historical data just in case, or to support a niche use case for a few people. For beginners, this can be especially challenging because the alternative approaches to deal with this scenario (like incremental refresh, hybrid tables, and dealing with aggregations or other storage modes) can be quite complex. If these approaches are too complex, beginners might want to consider solutions like separate, static models (that don’t refresh) for these niche scenarios. If you do need the advanced patterns, see Just Blindbæk’s blog on optimizing model memory.
- Group rows that you don’t need: Try to group (or aggregate) data as much as possible. Try to really limit data to the details you need in reports and analyses, and think critically about whether some columns are adding extra detail without really contributing to your report. Common examples are document or document line item numbers and codes.
- Disable Auto Date/Time: By default, Power BI will include a “hidden” date table for each date field in your model. These tables create the “date hierarchies” for these fields, and they can be very convenient for beginners, since they don’t need to create and use a date table. However, if you have a lot of date fields, especially ones that have wide ranges, then these hidden “auto date/time” tables can take up a lot of space. Disabling auto date/time will remove these tables, but you then need to create your own Date table, instead. Generally, the latter is recommended for most scenarios.
- Reduce decimal precision: In Power BI, model size is determined not by the number of rows, but by the sum of sizes for columns, relationships, and other in-memory objects. Column size, for instance, is largely determined by the number of unique values in that column. Therefore, the more decimal precision you have (the more numbers behind a decimal), the more unique values, and the larger the column. Thus, rounding these fields can reduce the column size dramatically, especially if there are many rows.
- Separate date and time fields: Related to the previous points, if you have time data, then you should really think hard about whether you really need it. Most of the time, you don’t. But if you do, you should strongly consider splitting the date and time fields into two columns. This will reduce the size of the model because it reduces the total number of unique values (cardinality) between these two columns.
- Disable the property IsAvailableInMDX for columns if you won’t use Excel on your model: This tip is admittedly already more advanced; however, it is still worth mentioning. If you will not query your model using MDX (which happens when you use pivot tables in Excel with a Power BI data model) then you can disable the column property IsAvailableInMDX. This removes the attribute hierarchies used for MDX navigation, reducing the in-memory footprint.
- Use integer or numerical data types for numbers (and not text/string): If your column is a number and you save it as text, it will take up more space than if you save it as an integer. An example might be the Billing Document Number column. Note that the memory savings shrink as cardinality rises: a high-cardinality integer column still has a large dictionary. Relationship columns benefit too, so long as the related column’s type matches.
If you follow the above steps, you’ll have a better model for all scenarios, and not just for use with AI. However, if you use Copilot, data agents, or other ways to “chat with your data”, then your foundation needs an additional layer to work.
Step four: Establish clear and concise context
That additional layer is context, in the broad sense: the set of information an LLM sees when answering a question, with the prompt being just one part of it. A good semantic model for human consumers already provides a lot of this information implicitly, through its structure.
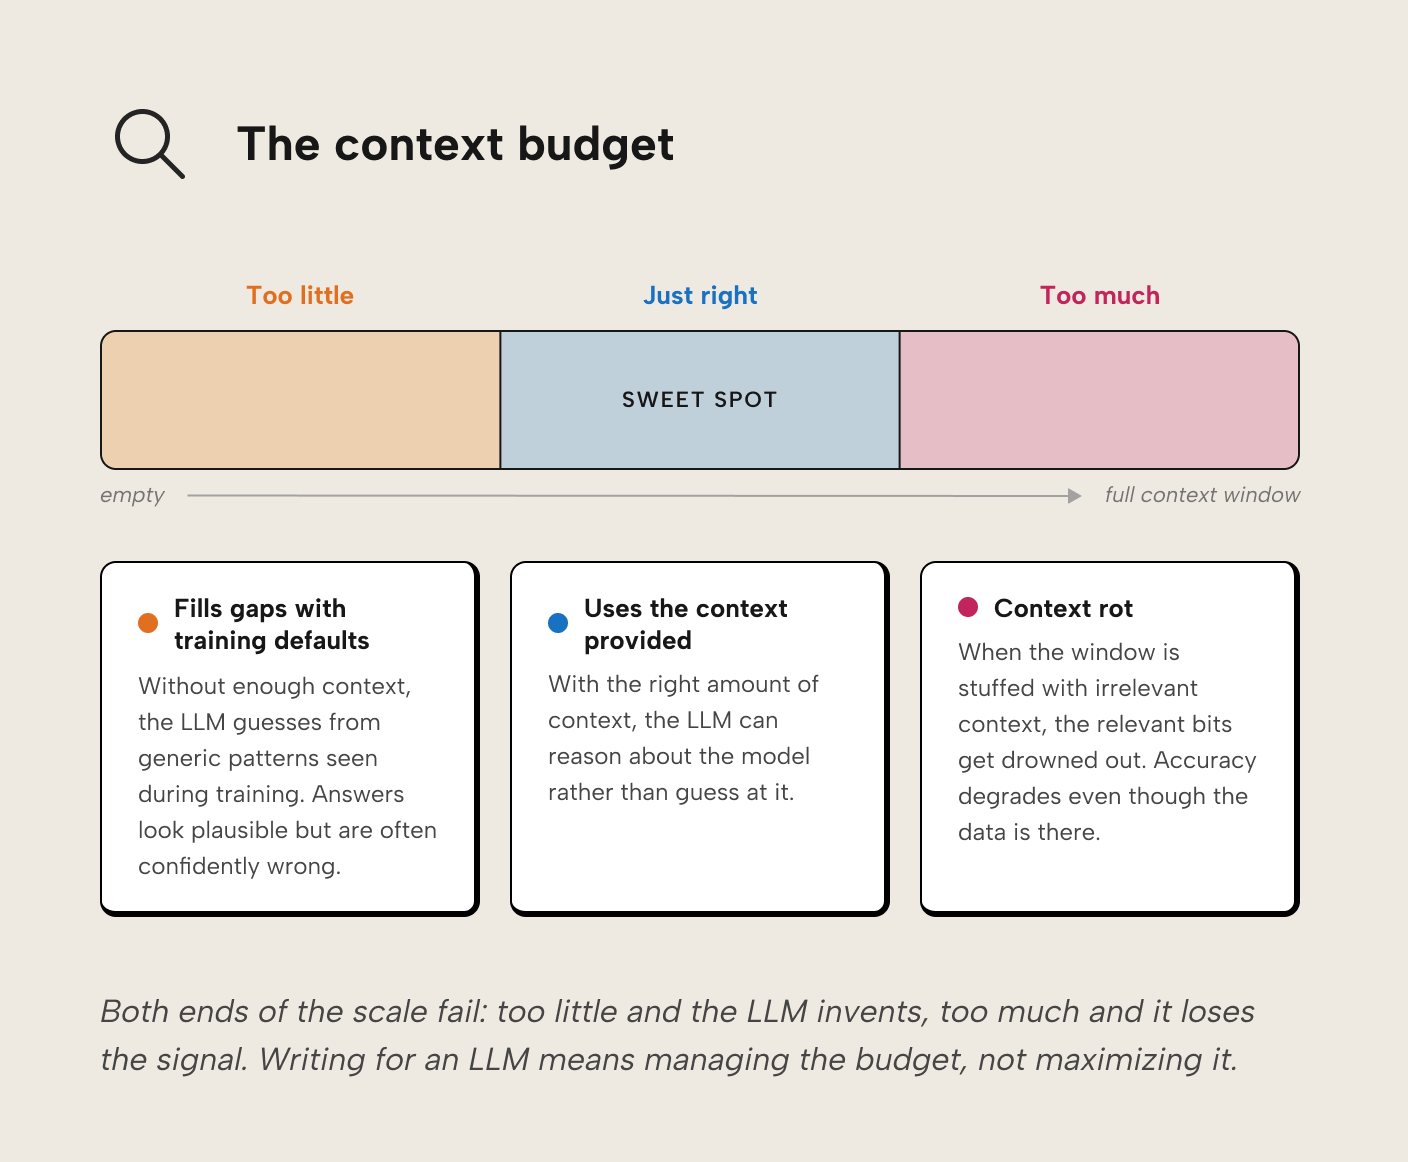
Context is a budget you manage, not a pile you preserve. Think of it like an open-book exam: you bring general knowledge into the room (basic accounting, how databases work, common revenue calculations), but when asked how this organization calculates revenue, you can only reference the pages on the desk. Too little on the desk and you fall back on general knowledge with a guess that might be confidently wrong. Too much and the relevant information drowns in what researchers call “context rot.” For an LLM, the desk is the context window, and its size is finite.
The inputs that fit on the desk can be grouped into four levers: structure, annotations and documentation, grounding anchors, and examples.
Structure
Good structure is self-documenting. The model itself encodes what things are and how they relate, so less has to be said explicitly. When naming conventions are applied consistently, there’s no need to write a description explaining that 'RVN' and 'Revenue' are aliases for the same concept; there’s only one way they appear.
A few structural properties that matter more for LLM consumers than you might expect, and that play out differently depending on which kind of agent is reaching the model (Copilot at runtime, a coding agent editing the TMDL, an XMLA client). The right structural choice depends on the agent you’re building for:
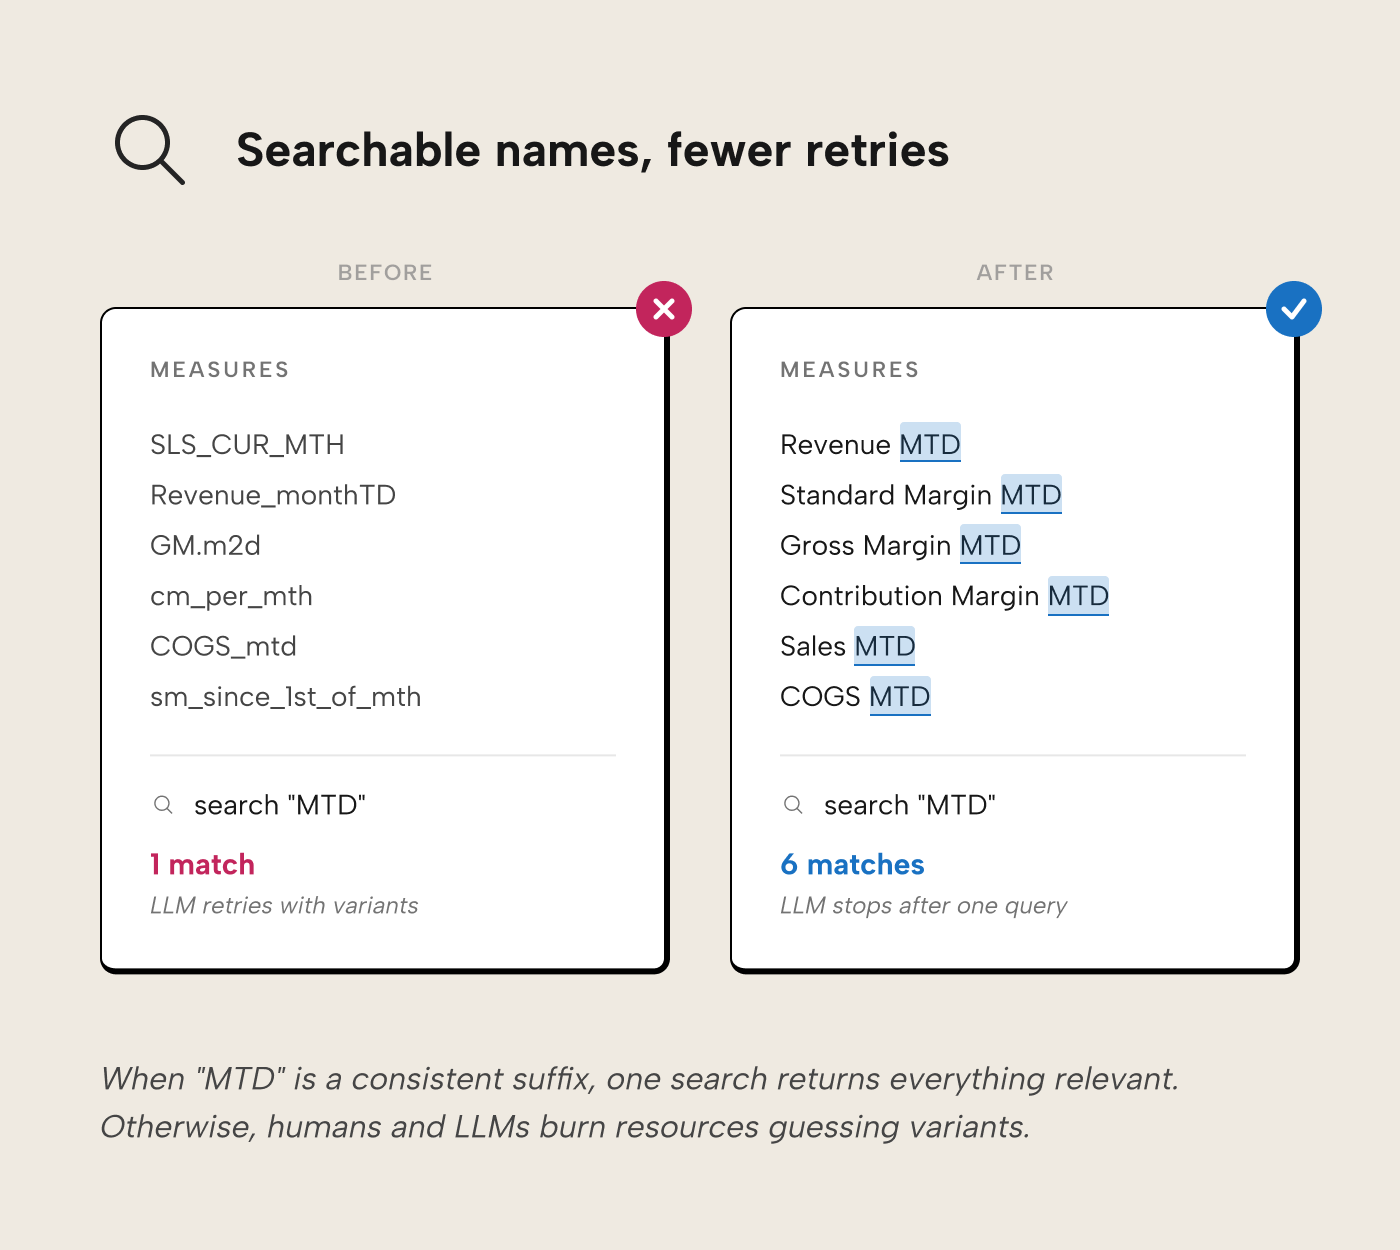
Consistent, searchable names. LLMs and humans both search by keyword to find measures. If time intelligence is always expressed as a suffix (Revenue MTD, Revenue QTD), a search for “MTD” returns all of them, and both the developer and the LLM can infer that a missing Gross Margin MTD simply doesn’t exist, rather than burning working memory or tokens trying month-to-date variants. Names should be business terms the organization actually uses, without acronyms, punctuation, or ambiguous terminology: use “standard margin” when that’s what you mean, not the bare “margin”.
Progressive disclosure. Show what's important first and keep advanced detail hidden until it's needed, on demand. Display folders do this for humans navigating the model (i.e. hiding advanced measures in folders that are opened only when needed). An AI consuming the semantic model doesn't benefit from folders: Copilot and data agents see every measure regardless of folder, since the folder is just a string property on each measure. An AI developing models using the PBIP format does benefit from progressive disclosure by loading relevant TMDL files and ignoring the rest.
Hide what shouldn’t be used. Hiding foreign keys in a fact table prevents analysts from creating meaningless integer aggregations (like the sum of year), and prevents an LLM from referencing them in DAX it generates. For Copilot specifically, you can go further with the AI data schema: an allowlist of tables, columns, and measures that Copilot and Fabric data agents are permitted to see, configured through the “Prepare your data for AI” experience in Power BI Desktop and Fabric. When you first open the AI data schema setup, Power BI uses
IsHiddento seed the initial allowlist. After that, the AI data schema is what Copilot uses for data-question answering. Other Copilot capabilities like report-page creation, search, and DAX queries etc. still use the entire model, so objects must still be hidden withIsHidden. An agent connecting via XMLA won't know about the AI data schema and will see everything that isn't strictly hidden. Fabric data agents are configured separately, through their own instructions, example queries, and per-table source selection.Expose the measures the agent needs. Implicit measures (the auto-sums Power BI creates when you drag a numeric column into a visual) aren’t queryable by Copilot or data agents as measures; every metric you want the AI to use needs an explicit DAX measure on the model. Report-scoped measures do not exist in the model so aren't queryable at all. If you’ve been relying on either, you have to centralize them into the model as explicit measures before AI tools can use them.
Star schema. A star schema is both the best-performing design and the design the LLM expects since it is heavily featured in its Power BI and Analysis Services training data. The LLM will tend to go looking for a "Customer Address" in the "Customer" dimension first and won't need to burn tokens exploring further if found there.
Annotations and documentation
Where structure encodes what things are and how they relate, annotations and documentation encode what they mean. This means writing down the information that can't be inferred from a table or column name alone: business definitions, agent behavior rules, synonyms for alternate phrasing, inline comments on DAX expressions, and links to external documentation.
Roughly in order of impact:
- AI Instructions. This is free-form guidance, usually in markdown, telling the agent how to behave. Here you encode rules that are awkward to put in descriptions or impossible to synonym. For example, “When a user asks for ‘margin’ without qualifying, they mean Standard Margin. Use that measure rather than Gross Margin or Contribution Margin.”
You can also steer or correct generic agent behaviors: “Always use existing measures if they exist rather than ad-hoc DAX. If you can’t find a measure for what the user asked, tell them before you query with your own calculation.”
Where instructions physically live depends on the agent: Copilot and Fabric data agents keep them on the model or agent itself (configured via Prepare your data for AI); coding agents like Claude Code or GitHub Copilot read them from their harness config files (CLAUDE.md, .github/copilot-instructions.md, .cursorrules). An agent only reads instructions it’s been explicitly pointed at and instructions don’t transfer between tools automatically. They are a powerful lever for consistency and the first place to come when you want to correct an agent the same way twice. - Descriptions. A description answers “what is this object for, and when should I use it?”. Both humans and agents make use of it, but not in the same way; humans see them as tooltips during report creation and AI reads it when navigating the model. We'll elaborate on this in a future article. Match the information you encode to the level of the description: use model-level descriptions for scope and conventions, table-level for what the table represents, column-level where names are ambiguous, and measure-level for measures that need more context beyond the name and DAX expression. Favor descriptions for objects where ambiguity actually exists, and skip the ones where the description would only restate the name. A good description carries the implicit information the name and expression don’t, e.g. “Standard margin = revenue minus standard cost of goods sold, using the valuated production cost from the manufacturing plant (SAP: VBAP-WAVWR, not COPA)” spells out what the measure is, how it’s computed, and which source-system field feeds it. Descriptions compete for the context budget: humans are likely to ignore a wall of text in a tooltip and verbose descriptions cost the LLM in context rot. Write the minimum that resolves whatever ambiguity you know could be there.
- Synonyms. Synonyms and linguistic modelling should help where business users genuinely use different words for the same concept. In our experience, linguistic modelling on top of other, standard context rarely produces a measurable, consistent improvement in conversational BI output that the investment suggests. Use them when there’s unambiguous synonymous terminology in the business, and don’t expect miracles. If you find yourself needing many synonyms to patch inconsistent naming, there's probably structural work needed on the naming conventions.
- Inline code comments. Agents reading DAX will be helped by in-line comments in expressions that clarify non-obvious logic. Comments also help the developer or coding agent who opens the DAX to change it later. They’re particularly valuable as a fallback where descriptions or synonyms don’t cover the ambiguity the expression carries.
- External documentation. Link to the source rather than copy-pasting from it. Confluence pages and data catalog entries change and are stale the moment you copy them. A link also sidesteps the context-budget problem: the agent can fetch the external page when needed rather than carrying the full text in every turn. Keep in mind that the agent has to be able to fetch the linked page, meaning public URLs or resources it’s been authenticated to access.
WARNING
Do not use AI-generated metadata. Description-generation features (and agents asked to “write the descriptions”) only restate what’s already visible in the model. If the AI can write the description from what it already sees, the description has nothing new to tell a downstream agent reading the same model. Descriptions are useful when they add implicit information the model doesn’t already expose. Synonyms are a different case: treat AI-generated synonyms as suggestions, not truth, and keep only the ones that reflect genuine business usage.
Grounding anchors
Think of a swimmer crossing the English Channel: without buoys marking the route, the swimmer drifts off course regardless of skill and might end up at the shores of Denmark. LLM-based agents are similar. Without checkpoints to validate their own output, they drift and their mistakes compound. Worse, an agent with no anchor to verify against tends to treat its previous output as baseline truth; small errors reinforce themselves rather than getting caught, and the drift accelerates. When the intermediate output of an agent doesn’t match the grounding anchor, the agent should stop, investigate the root cause, and only continue once the output is aligned again.

Grounding anchors can be specific values (e.g. 2025 revenue is 1,643,486.85 USD for the EMEA region; the top-selling brand of Q4 2025 is “Volcanic”), or relative rules (e.g. revenue is always greater than zero; paying customers in Q4 are always more than in Q3).
- Golden datasets. A curated set of known-correct values the agent can query for reference. Useful for spot-checking calculated results before the agent commits to an answer.
- Documented edge cases. Situations the model is known to handle awkwardly: customers with no orders, transactions in currencies without a conversion rate on the reporting date, products that changed SKU mid-quarter. Telling the agent about these cases up front prevents it from quietly miscounting.
- Verified answers (Copilot). You can configure verified answers in Copilot so specific questions return a known response. The current state of verified answers is limited, though; no report-theme support, and the knock-on inconsistency in look and feel can bite. For now, we’d reserve verified answers for basic visuals that Copilot consistently fumbles, rather than treating them as a primary grounding mechanism.
Examples
Where annotations and documentation tell the LLM what revenue means, examples show it what a correct revenue measure looks like in the Sales MTD EMEA semantic model. Without examples, the LLM applies generic patterns from training data that may clash with the organization’s conventions or misuse the logic. When we bark orders in prompts to “follow best practices,” how do we know which best practices the LLM will try to adhere to?
We can’t. If we show the LLM a few DAX measures that adhere to SQLBI’s standards instead, we can generally expect output that shows traces of the examples. Examples also show how seemingly simple things a model might struggle with are actually done. A DAX query always needs an EVALUATE statement, for instance.
Examples that earn their keep:
- A canonical measure written the way you want (e.g. a Revenue MTD using your preferred VAR/RETURN pattern and KEEPFILTERS where it matters). The agent mirrors the structure when asked to write more.
- A prompt-response pair from a past session: the user’s question alongside the DAX query that answered it well. This encodes your question-to-query mapping.
- A trickier pattern, documented, like a time-intelligence measure using your fiscal calendar, or a DAX query that handles an edge case (currency conversion on nulls, say) that generic training data misses.
For an LLM, examples are the pictures worth a thousand words.
TIP
Kurt Buhler maintains a review-semantic-model skill for coding agents that audits a semantic model against many of the checks this article walks through, then produces prioritized findings. Below is a short demonstration of the skill in action, used by an agent running in Claude Code Desktop. The agent finds several issues, and returns a prioritized list of suggested fixes.
For further reading
- Naming conventions for Power BI semantic models (tabulareditor.com). Directly implements the consistent, searchable naming conventions this article identifies as the most impactful structural lever for LLM consumers.
- Agentic development of semantic models in simple terms (tabulareditor.com). Next step for using AI agents to build, not just consume, a semantic model that meets the readiness criteria here.
- Effective context engineering for AI agents (Anthropic). Anthropic’s framing of context as a finite budget to curate, the research that underpins the context-management approach in step four.
- The importance of star schemas in Power BI (SQLBI). Demonstrates with concrete examples why a star schema is the structural foundation both for accurate DAX results and the pattern LLM training data most expects.
In conclusion
If your semantic models have solid foundations -- star schema, descriptions where relevant, etc. -- then AI readiness is already within arm's reach. Give the AI agents deliberate instructions where needed and a source of truth to ground on, then see what they do and tune further. The good news is that improvements to the foundations you may still need to make benefit people and agents alike; two birds with one stone.
Prepare semantic models for AI with cleaner metadata in Tabular Editor 3.
Give Tabular Editor a spin